How to Calculate & Reduce Customer Churn Rate (2024)
This in-depth guide explores customer churn, common causes of churn, tips to reduce churn, and an interactive calculator to measure your yearly customer churn rate.
Acquiring new customers is exciting, but for many SaaS businesses, that excitement is undercut by the time it takes to break even on acquisition costs.
According to For Entrepreneurs’ 2020 SaaS survey, the average time it takes for new customers to become profitable is 2.4 years.
For example, say you spend $240 — which would be on the low side — to acquire a new customer who pays $40 per month. It would take six months for that customer to become a positive investment.
This time-to-profitability problem is especially troubling when you consider customer churn. Customers often churn or cancel their subscriptions before they pay back the cost it took to acquire them and become profitable.
This is why customer churn rate is just as important to track as your rate of growth; your churn rate must stay lower than your growth rate for your SaaS company to remain profitable – meaning its critical to predict and prevent churn.
Understanding your churn rate gives you clear indicators of when to invest in customer retention rather than just acquiring new customers.
In this article, we’ll talk about the customer churn rate, how to calculate it, and the steps you can take to reduce it.
What Is Customer Churn Rate?
Customer churn rate measures the percentage of customers who stop paying for your service over a defined period. It’s calculated using the following formula:
(Lost Customers ÷ Total Customers at start of period) x 100
Customer churn rate, also known as the rate of customer attrition, is not to be confused with revenue churn rate, which is a measure of lost revenue.
Customer Churn Calculator
What's the Average Churn Rate by Industry?
Every business sector has unique characteristics and factors that impact its churn rate. For organizations looking to benchmark and compare their customer churn, you must compare it against similar companies in their industry to thoroughly understand your retention health and build industry-specific retention strategies.
Below is a sector-based breakdown of median churn rates, from highest to lowest.
- Logistics: 40%
- Manufacturing: 35%
- Telecommunications: 31%
- Professional Services: 27%
- Healthcare: 23%
- Financial Services: 19%
- Insurance: 17%
- Media: 16%
- IT Services: 12%
- Utilities: 11%
Sources: Customer Gauge, Aspect
What Is a Good Churn Rate for SaaS Companies?
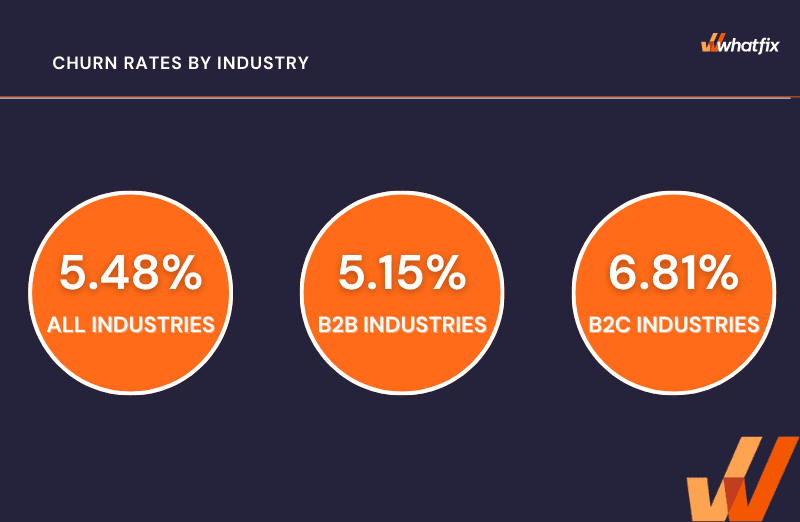
In a 2019 survey of nearly 2,000 businesses, Recurly found the average SaaS churn rate to be 4.55%: 4.67% for B2B: and 4.71% for B2C.
That said, you should expect your SaaS churn rate to vary based on a number of factors:
- Pricing: Recurly found higher-priced services experience less churn than lower-priced services where subscribers cancel more readily.
- Age in business: A ProfitWell study found businesses older than ten years have lower churn rates (2 – 4%), whereas younger companies have higher rates in the range of 4% – 24%.
Still, SaaS companies have some of the lowest churn rates across different industries.
Voluntary vs. Involuntary Churn
- Voluntary churn occurs when a customer decides to stop using a product or service. Reasons for voluntary churn can include price increases, poor feature coverage, a change in needs, a better fit from a competitor product, or overall dissatisfaction.
- Involuntary churn occurs when customers have payment-related issues. This may be due to unavoidable issues like companies going out of business or not having the budget or funds to pay for a subscription, or due to issues in the payment process like service errors or payment failures due to expired cards.
Reasons for Customer Churn
Customers churn for many reasons — reasons that are unique to each customer. However, the most common reasons typically fall under the following categories:
- User experience: If your product or service is buggy, glitchy, or otherwise difficult to navigate, customers will be less inclined to use it and will likely explore options that are designed with the user in mind.
- Unrealized value: In order for customers and users to stick around, they need to realize the value of a product. Poor user onboarding experiences lead to unrealized value due to customers not understanding how to use features, being unaware of features, and not understanding why they need it. This ultimately leads to poor user adoption rates and eventually churned customers and users.
- Product/market fit: Poor product/market fit speaks to the need for close sales and customer service alignment. Suppose salespeople are hustling to hit quota and aren’t incentivized to sell to customers that would actually benefit from your product. In that case, churn is inevitable as the customer will quickly realize they can’t achieve their goals using your solution.
- Price: If customers find a more cost-effective option for the problem they’re trying to solve, they are likely to churn. That’s why it’s crucial to establish value and customer onboarding and education so customers feel that the purchase is worth the cost.
Being mindful of these common reasons customers pull away can position you to approach your customer experience strategy more intentionally.e
How to Calculate Customer Churn Rate
Above, we mentioned the formula to calculate churn rate is (Lost Customers ÷ Total Customers at start of period) x 100. Let’s walk through how to use the formula:
- Decide a time period to calculate for – this could be a month, a quarter, or a year.
- Determine the number of active customers at the beginning of the period.
- Track the number of customers who canceled by the end of the period.
- Divide the number of canceled customers by the number of active customers at the start of the period.
- Multiply that number by 100.
For example, if you start the month of August with 2,000 customers and 50 of those leave by the end of the month, your Customer Churn Rate for August is 2.5%.
While this method doesn’t account for new sign-ups within the period, that’s a good thing. The goal of calculating your churn rate should be to understand how well you retain existing customers, which is separate from acquiring new ones.
7 Tips to Reduce Your Customer Churn
To reduce your churn rate, you need a solid customer retention strategy. Here are five steps to help you retain more customers and reduce churn.
1. Improve your customer onboarding experience
According to a ProfitWell study, customers who say they have a good customer onboarding experience are 5% less likely to churn than customers who don’t. Here are some tips to improve your customer onboarding experience:
- Minimize friction: Address the causes of user friction like product bugs, broken features, performance issues, user dropoffs, and product navigation issues so customers don’t have a painful user experience. Then incorporate self-service support options so customers can get immediate solutions to problems they encounter while using your product.
- Reduce the time to value: Guide customers to results so they can see the value in your service faster. Create knowledge databases, video tutorials, email sequences, and in-product prompts that tell them exactly what to do and how to use your product to get results.
- Personalize the experience: Your service likely has more than one ideal user persona, so customize your service to match the needs of each persona. Use the data you collected at the time of sign-up to guide specific personas to the specific results they need.
2. Monitor user adoption and continuously improve user proficiency
User adoption stats provide insight into when users completely invest in your service. They indicate when people stop shopping for alternative services and commit to your product. In other words when they decide not to churn.
The best way to track adoption is to use a user adoption solution like Whatfix to track metrics like user activation rate and feature adoption rates.
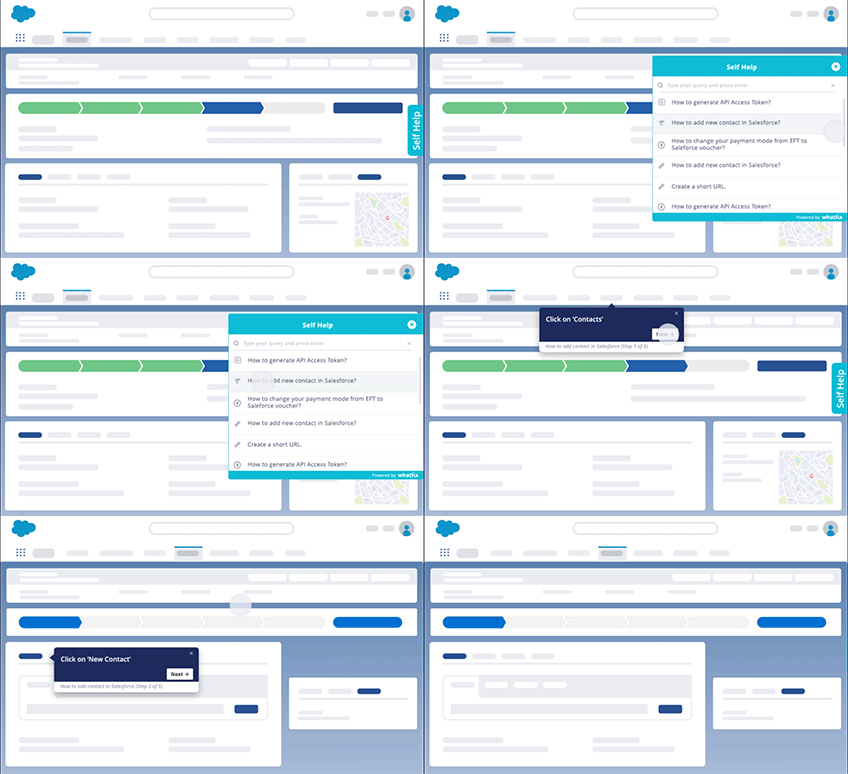
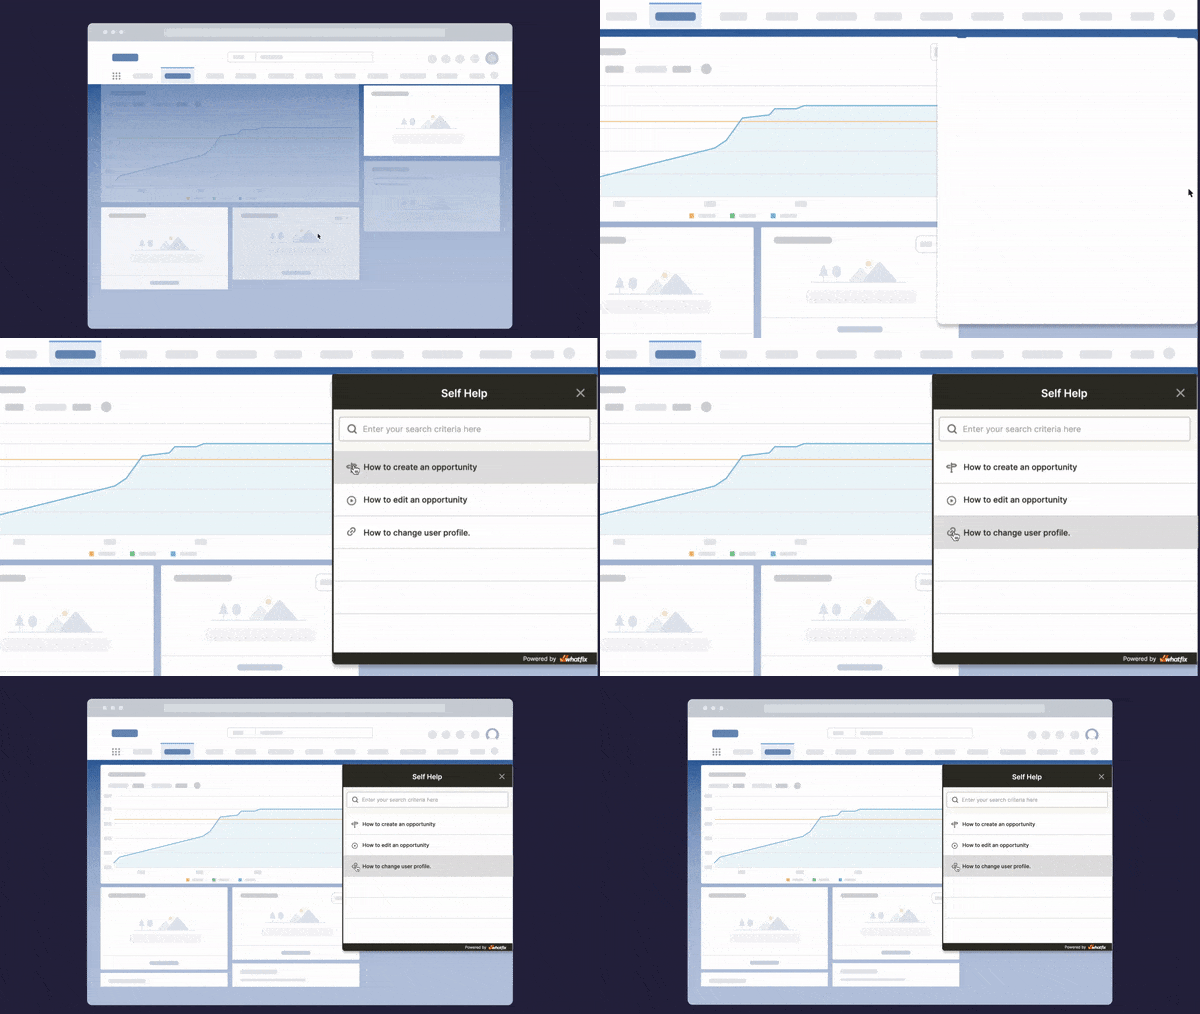
Low adoption rates typically stem from poor user understanding and proficiency; people won’t use a tool if they can’t figure it out. Digital Adoption Platforms (DAPs) like Whatfix lets you create walkthroughs, tutorials, and other in-product support features to help your users make the most of your software from within the software itself.
3. Create open communication channels with your customers
Open communication channels encourage customers to reach out with issues or feedback and allow you to resolve customer issues before they escalate to churn. At the very least, setting up a chat button in your product allows customers to get answers to questions without waiting.
But don’t stop with in-app chat support alone. Some customers take their grievances to social media — 35% according to an American Express report — so you need to be available on the different platforms where users hang out e.g. Twitter or Facebook.
For example, when Buffer was hacked in 2013, people immediately started tweeting about it. If Buffer wasn’t available to respond to tweets almost immediately, the situation would have escalated and caused heavy churn. Instead, Buffer was able to quickly manage the situation and even win users’ trust while they resolved the issue
4. Track and monitor NPS and CES scores
Customer-success metrics like Net Promoter Score (NPS) and Customer Effort Score (CES) are indicators of how well your customers are satisfied with your service.
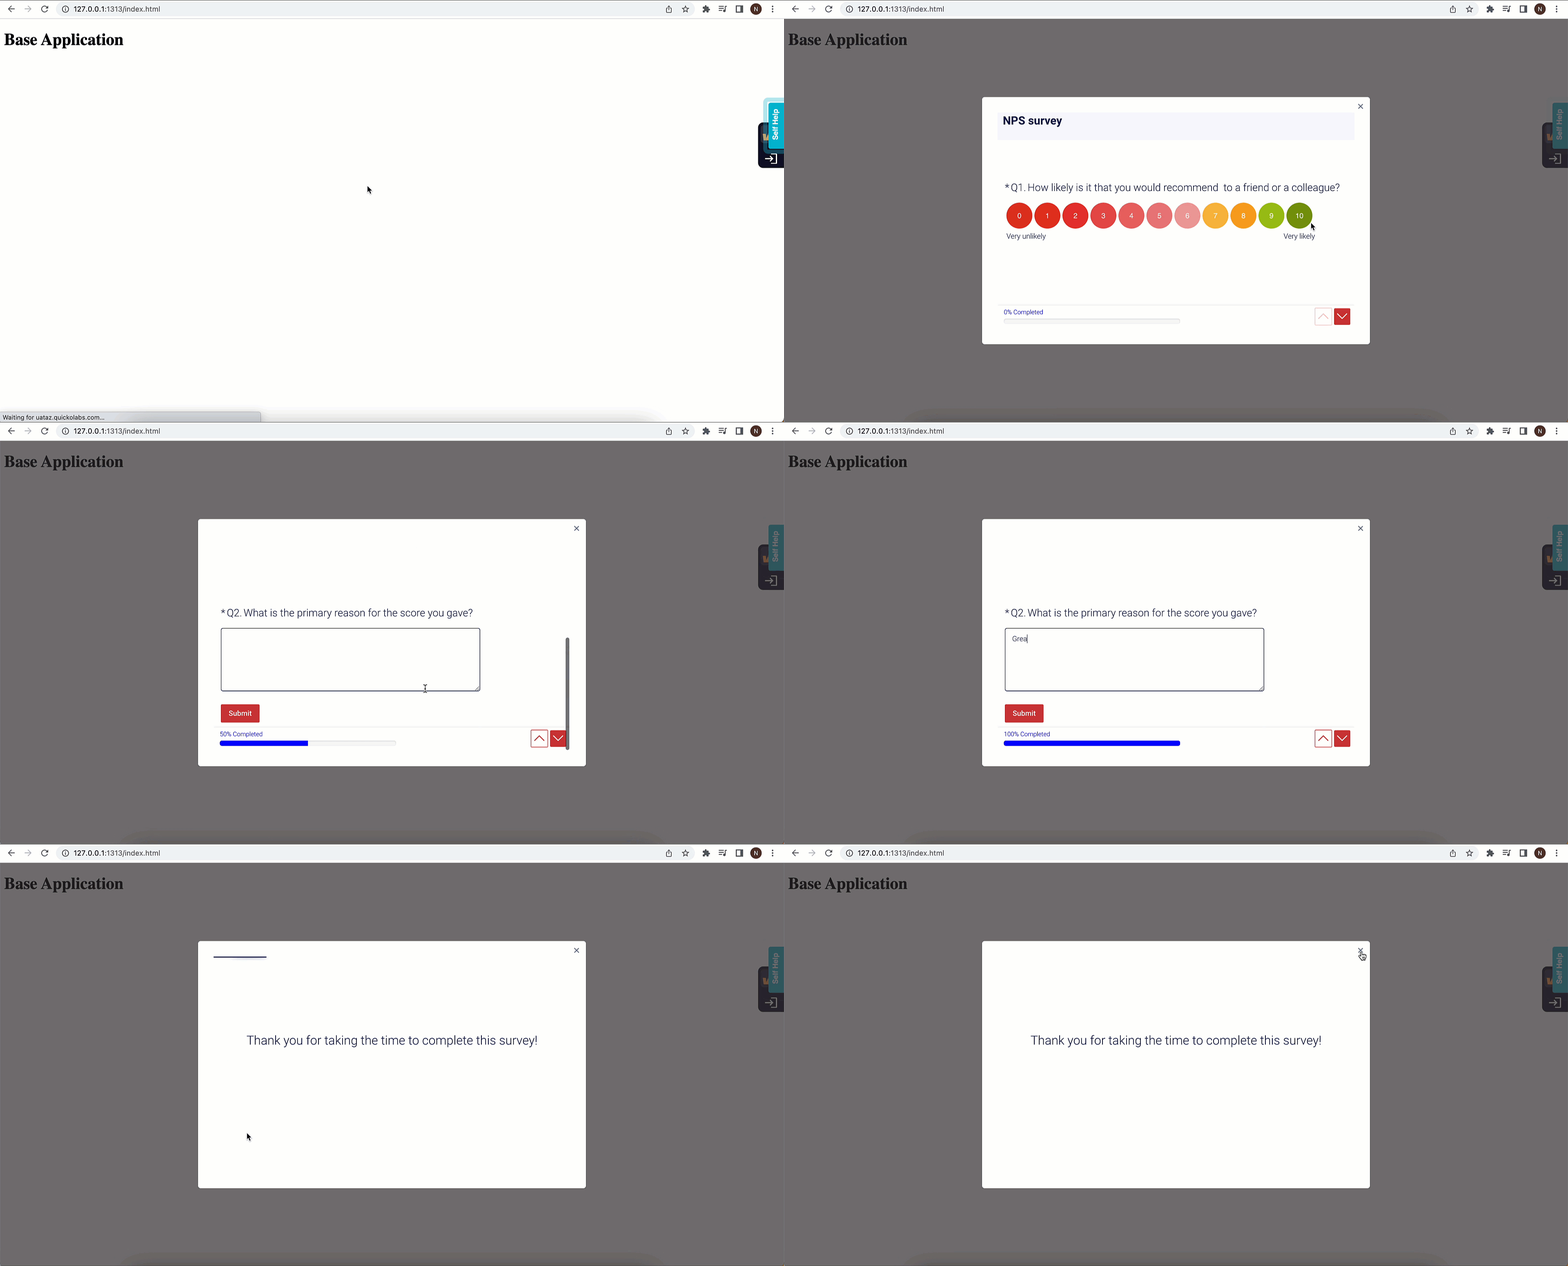
NPS scores indicate how likely users are to recommend your service to others. Generally speaking, the higher your NPS score, the lower the risk for churn. CES scores measure how easy or hard it is for customers to use your product. Undoubtedly, if customers find your product difficult, they are more likely to churn.
Customer experience tools like Whatfix help you track and monitor both your NPS and CES scores with surveys.
5. Use customer feedback to guide your product roadmap
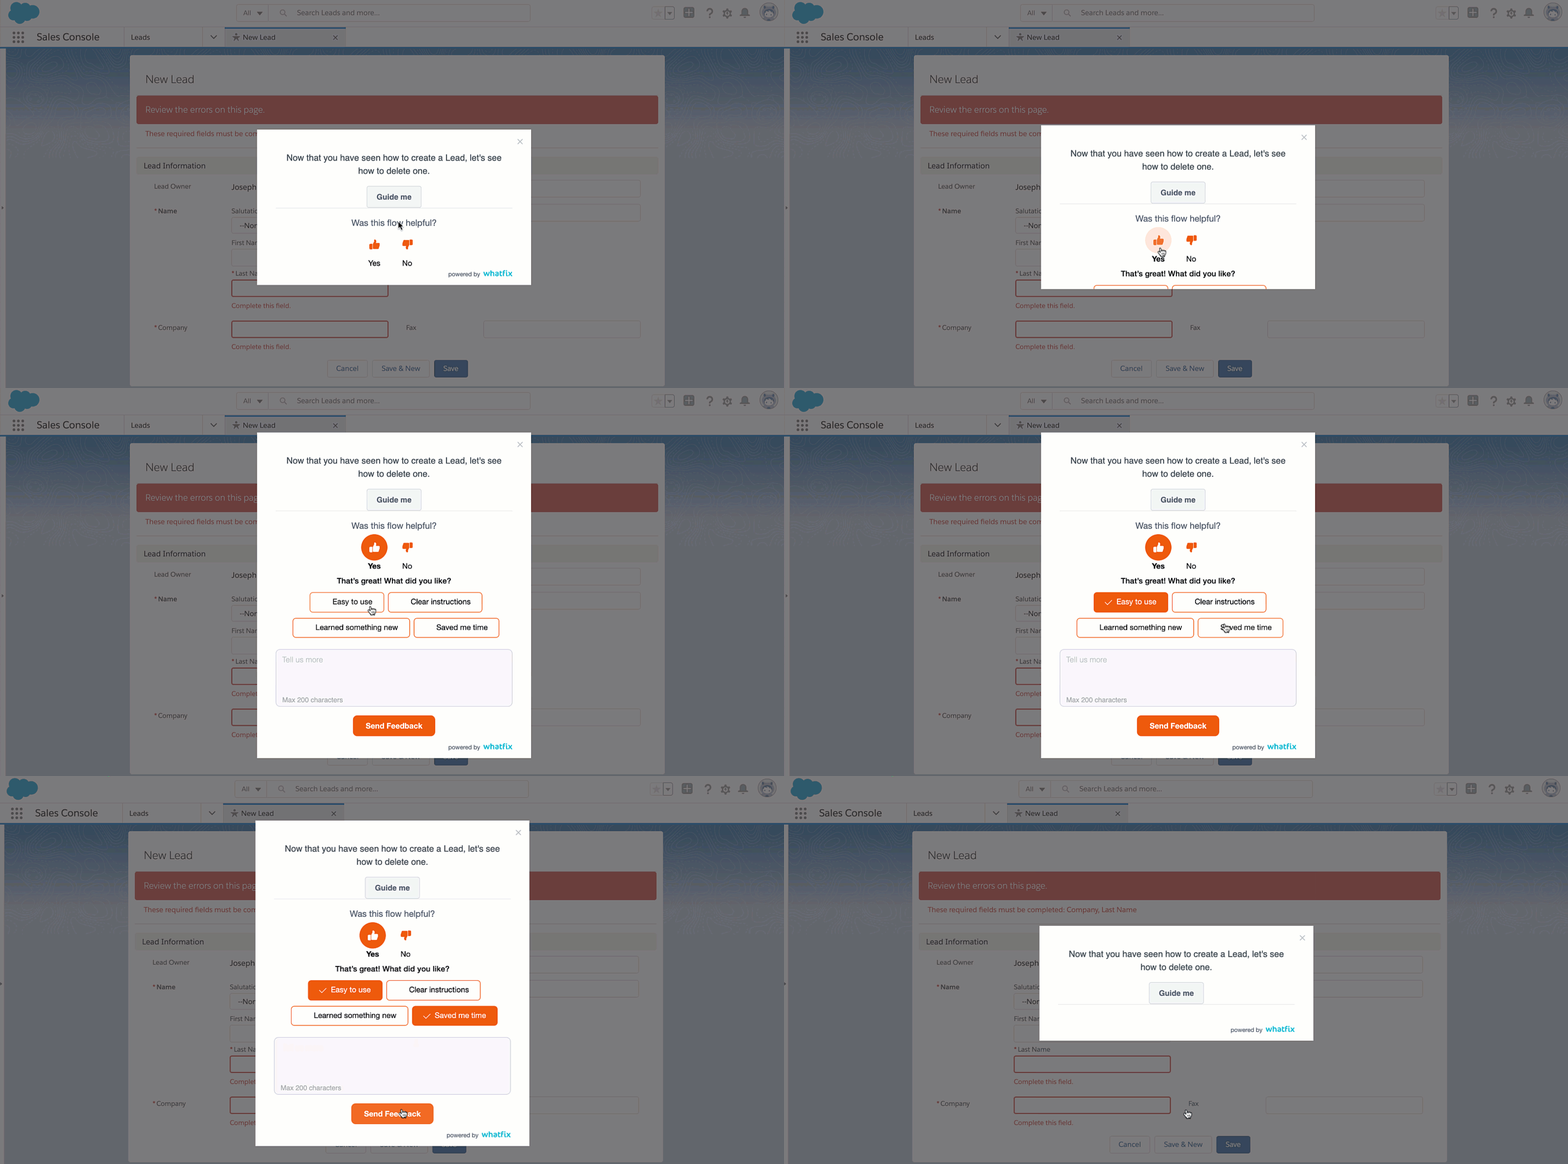
Customer feedback gives you clear signals about how to make a product that provides user value and, in turn, keeps customers around. If a dozen customers express frustration that your product lacks integration with another widely used app, this gives your product team a clear signal that getting the development work for the integration into your product roadmap will likely satisfy your customers and, in turn, decrease churn.
Prioritize issues to solve based on their impact level. For example, a bug that makes it impossible for API calls or integrations to work is a more pressing issue than a slower app load time.
Finally, consider solutions your customers suggest in feedback; they could lead to better outcomes.
6. Stay competitive in your market
Market conditions are constantly evolving. As new technologies and tools enter the arena, you should expect the needs and demands of your customers to shift as a result.
Businesses that keep their finger on the pulse of upcoming tech, trends, and product developments position themselves well to avoid disruption and stay ahead.
It’s equally as important that your customer success and support efforts remain relevant. To ensure your competitors aren’t getting ahead of you, monitor and make note of their customer success initiatives. Getting inspiration from their strategy can help your business better serve and save customers.
7. Provide excellent customer service
Providing excellent customer service is a great way to stand out among competitors and reduce customer churn.
Your customer support and service reps should be equipped to effectively assist customers when they’re working on fixing an issue or answering a question. Creating call center scripts can help your customer support agents solve customer issues faster.
Many big enterprises like Amazon or Zappos are huge companies because they focus on customer service from the beginning.
A high customer acquisition rate means little for business if the churn rate is just as high. But your goal shouldn’t be a 0% churn rate; customer churn is inevitable and certainly not a mark of failure.
Instead, consider it a learning opportunity that helps you create a better product to meet customers’ needs. That way, you’ll retain more of the customers you’ve worked so hard to acquire and experience a sustainable growth rate.
With a tool like Whatfix, organizations can create in-app guidance and help content in a no-code editor, meaning they can create product tours, interactive flows, step-by-step guides, tooltips, task lists, and more – all without the need for engineering resources.
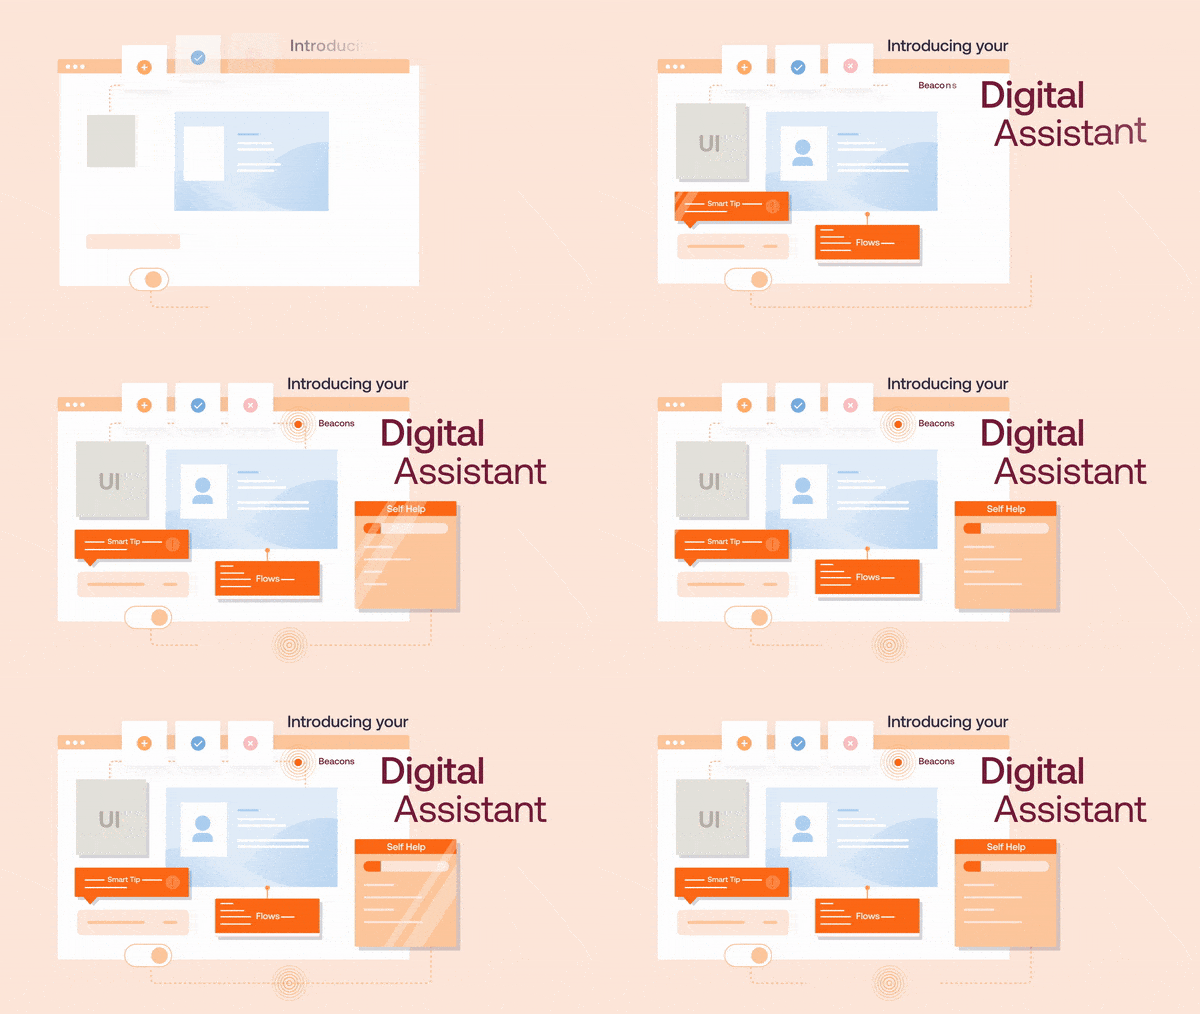
With Whatfix Analytics, understand how your users are engaging with your application, how they’re using it, and if they’re adopting it.
With Whatfix, identify user cohorts and segments to create contextual in-app guidance. For example, our partners use Whatfix to create multiple onboarding experiences that are tailored to different user personas, depending on how a customer is using an application.
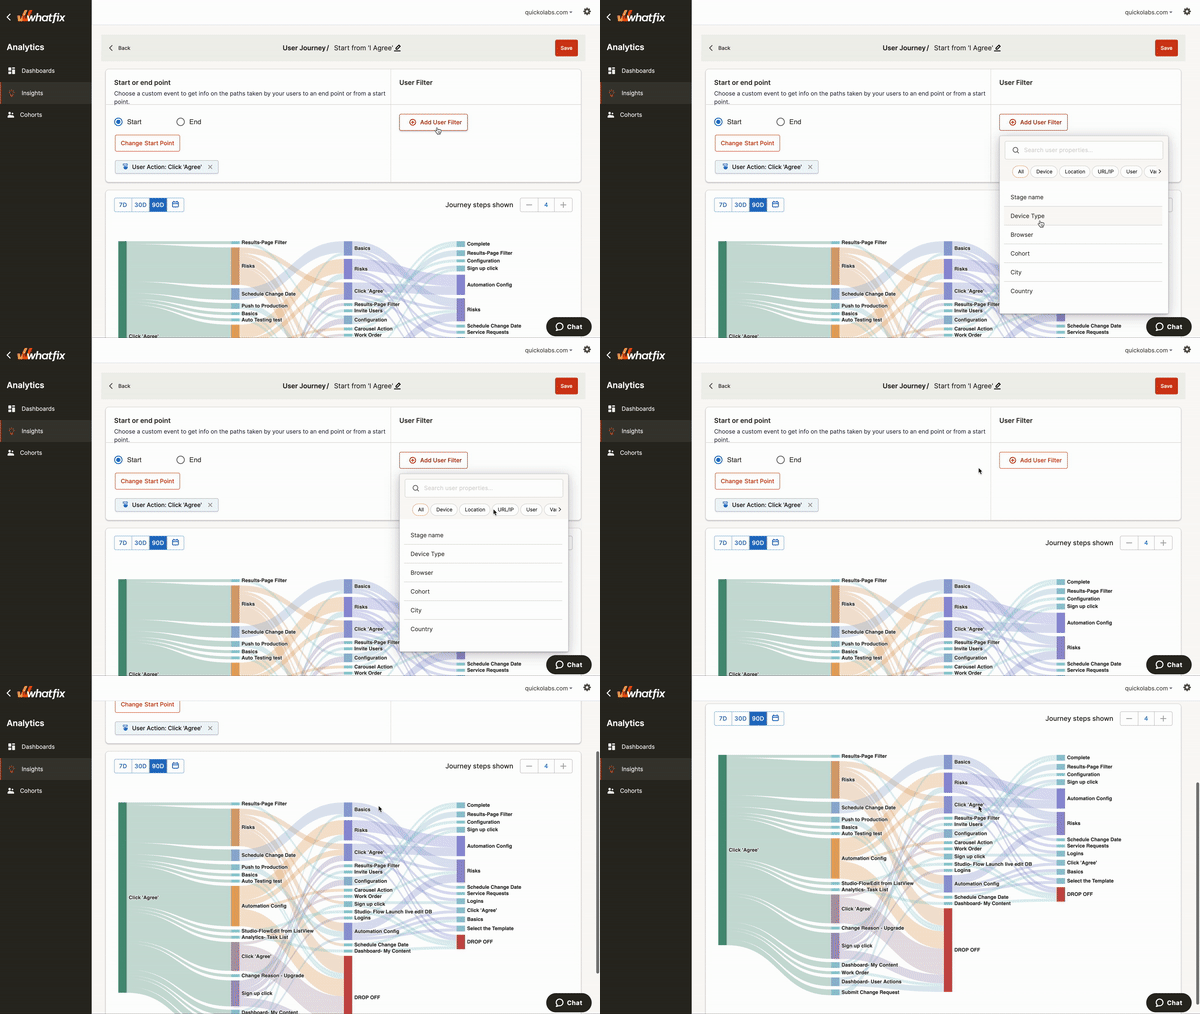
Whatfix’s digital adoption platform empowers your employees, customers, and end-users with in-app guidance, reinforcement learning, and contextual self-help support to find maximum value from software.
Thank you for subscribing!
