According to a report by First Page Sage, the average B2B SaaS company spends $1,450 acquiring a user. For enterprise SaaS companies, it’s 10x that amount, at $14,772 per user. It’s not unusual for SaaS startups to spend 92% of the first year’s revenue on customer acquisition.
Even then, it’s not enough for users to simply sign-up for your application—they have to use it.
The churn rate for mobile apps is 70% on average (i.e., over three months) and peaks at 97.7% for middle-core games. And getting users to try out your product isn’t an end goal either; they need to use it consistently, which means you need a product adoption strategy. For example, the average person has 80 mobile apps installed but only uses 9 apps per day.
You must understand your user personas and focus on personalizing acquisition, onboarding, and retention efforts, or risk a leaky funnel.
That’s the problem product stickiness solves.
What Is Product Stickiness?
Product stickiness is the ratio of your product’s daily active users (i.e. DAUs) to monthly active users (i.e. MAUs). It’s a widely used metric for measuring product engagement created at Facebook to calculate how often users log into their accounts and use the product.
Calculating product stickiness helps product teams and growth engineers to understand who finds the most value in the product, double down on marketing to them, and understand where they need to change or improve the product to attract more of their ideal users.
How Do You Calculate Product Stickiness Ratio?
Product stickiness is the ratio of monthly active users to daily active users expressed as a percentage. The simple formula for calculating the stickiness of a product is: (DAU/MAU) *100
What’s the Average Product Stickiness Ratio?
The average product stickiness ratio for the SaaS industry ranges between 13% to 20%, depending on who you ask. That is, for every 100 users who use your product monthly, at least 13 of them will be active daily.
Product stickiness ratios vary across industries and niches, and understandably so.
For instance, it’s easy to go several weeks without playing songs or listening to a podcast on Spotify, ordering food delivery, or reviewing a restaurant on Yelp. But it’s harder for the average user not to check social media daily to catch up on the news, see what their friends are up to, and get entertained.
In fact, the average user opens Facebook at least eight times a day (Forrester) and spends 33 minutes (Broadband Search) a day browsing the application. That’s roughly 16.5 hours spent on Facebook a month. On the other hand, most American consumers (61%) only order food delivery once a week.
Product stickiness depends very much on:
- The type of application (social media, fintech, B2B SaaS, mobile gaming, etc).
- Your product strategy (freemium vs. paid).
- Your users’ demographics (i.e. age, location, gender, etc.).
- Your promotion strategy (i.e. whether you use notifications to nudge inactive users back to your product).
Analyze user behavior and track product usage with Whatfix Analytics
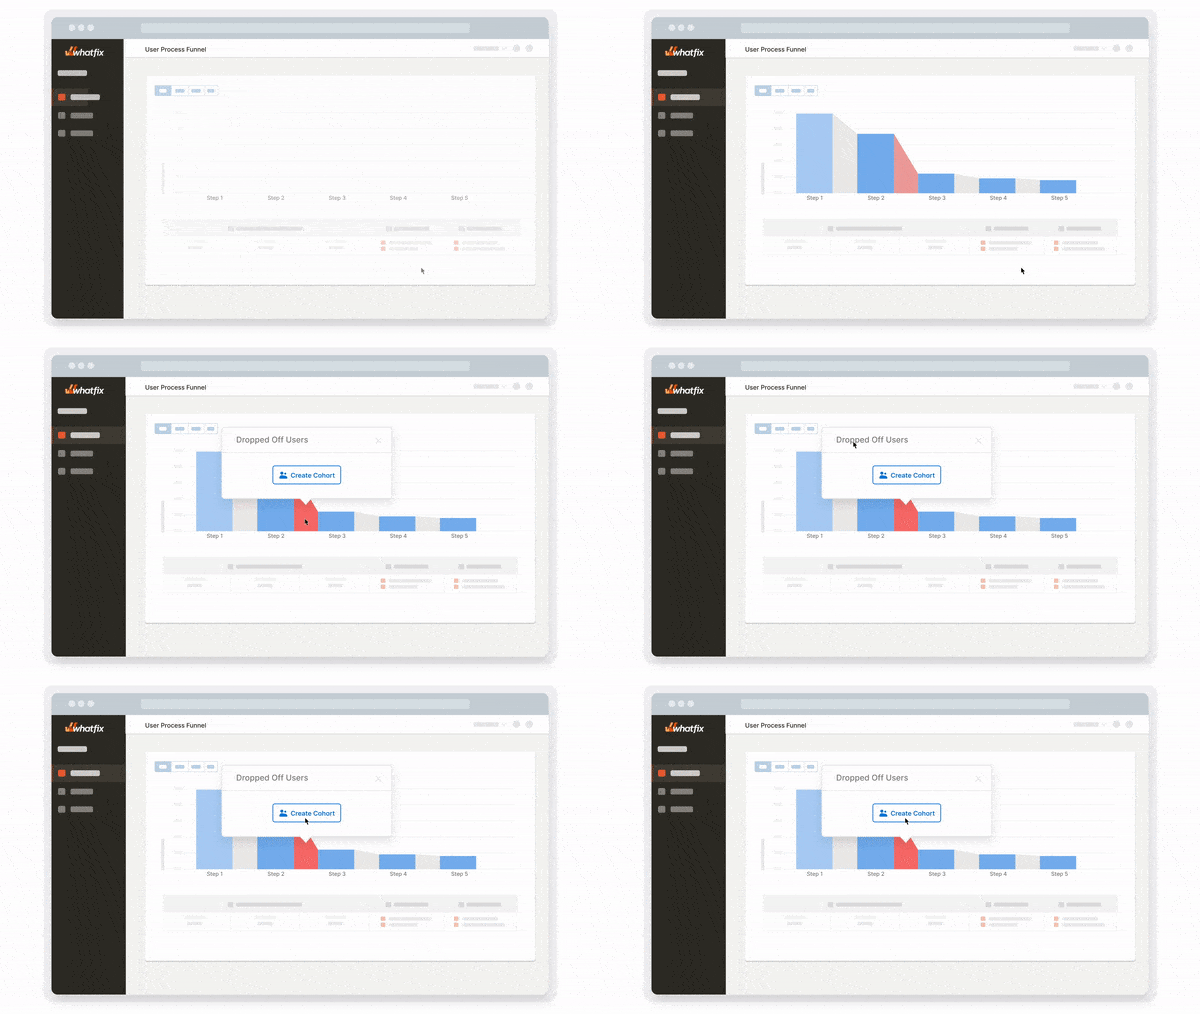
Enable your product managers to easily track and analyze user behavior and product usage with Whatfix Analytics, a no-code event tracking solution. With Whatfix Analytics, capture all user actions without engineering support, understand product usage, identify dropoff areas, understand feature adoption, map user journeys, build user cohorts, and make data-driven product decisions.
How to Use Product Stickiness Data
A product stickiness score is just a step in your overall product analytics strategy to help you understand why your engaged users keep returning to your product.
And that, itself, is the biggest secret to growth: once you understand your ideal user, you can:
- Narrow down your marketing efforts to target similar users.
- Design re-engagement campaigns that target unengaged users.
- Identify users who are more likely to churn (i.e. new users who are similar to your existing users. with lower daily usage) and target them with promotional offers, re-engagement emails, alerts, notifications, etc.
Let’s break down these three points into better explanations to help you understand how to use product stickiness metrics to market your product and create a more engaged user base.
1. Benchmark your product usage rate
A product stickiness score is not a magical growth hack that’ll help make your users suddenly love your product overnight—at its core, it’s just a metric that shows you how engaged your users are by measuring their daily and monthly active usage.
Before we proceed, you need to understand your product usage and define daily and monthly active usage.
- Daily Active Users: This metric measures the number of users who use your product actively within a 24-hour period.
- Monthly Active Users: refers to the number of unique users who have completed a meaningful action inside your product within the last 30 days.
But, you may be wondering, “can’t I figure out how many engaged users my product has by measuring DAUs and MAUs?”
Well, yes and no.
Active user metrics show you the number of users who complete a measurable action inside your application on a daily, weekly, or monthly basis. But, unless you compare those metrics against your product benchmarks, you won’t be able to measure your engagement levels, and you’ll be limited in how to use that data.
Product stickiness shows you your daily active users as a fraction of your monthly active users and helps you look at your user base from a more critical angle. It shows you your most active users and those who’re likely to churn and, as a result, you can:
- Create custom promotional campaigns designed specifically for users with lower stickiness scores who’re more likely to churn (i.e. growth engineers).
- Segment users based on their stickiness scores and focus your re-engagement efforts on users with low stickiness ratios (i.e. marketers).
- Understand who your most-engaged users are and redesign your marketing campaigns to target similar audiences (i.e. for marketers).
- Calculate your product’s adoption rate, i.e. how likely new users are to keep using it over time.
Your product stickiness ratio turns MAUs and DAUs from an informational data point into actionable product adoption metrics that product managers and growth engineers can use to create a balanced product strategy.
2. Understand what user are most active
Your product stickiness score shows you which of your active users are most engaged. And that’s the strongest growth tactic to leverage. Instead of cranking up your user acquisition budget and using all kinds of gimmicks to make your prospects love your product, it’s far better to sell to customers who will use it anyway.
Now, I know that’s a bit confusing, but stay with me for a bit. Product stickiness shows you which users are most engaged. Using product analytics, you can observe their use cases, and demographics such as age, location, acquisition channel, pricing tier, etc.
Studying those data points, in a way, helps you predict the future and shows you the customers who’re more likely to respond to your marketing campaigns, promotional offers, ads, etc.
For example, a Salesforce implementation costs anywhere from $5k to $100k on average. Looking at that figure, it’s easy to see that most startups can’t afford that much. So, if Salesforce spends a significant chunk of its budget on campaigns targeting early-stage startups, it would get minimal ROI and most of the new users they win over will eventually churn.
On the other hand, Salesforce knows from experience (including studying its stickiness rates) that their ideal customer is a large enterprise with tens or hundreds of SDRs—they are the users who find Salesforce most helpful and are most likely to stick with the product long-term.
Product stickiness helps you understand who your ideal users are so that you can focus your marketing and growth resources toward catering to them.
3. Identify ways to improve the stickiness of your product
Product stickiness can also be a positive product feedback loop—measuring it helps you see patterns in your user base. And when you study those patterns closely, you will understand how to build a better product or attract ideal users.
For instance, if your product stickiness survey shows that your most active users are teams of 11 – 50 persons, it might be a sign that you should spend less of your budget promoting your budget to solopreneurs and single users.
Product stickiness uses product analytics, user behavior, and demographic patterns among your ideal users to show how you can refine your brand, customize your product, and mold the experience to serve the users who are more likely to love your product.
How to Build Sticky Products With Whatfix
Whatfix is a digital adoption platform designed to help product teams and growth engineers build sticky, engaging products.
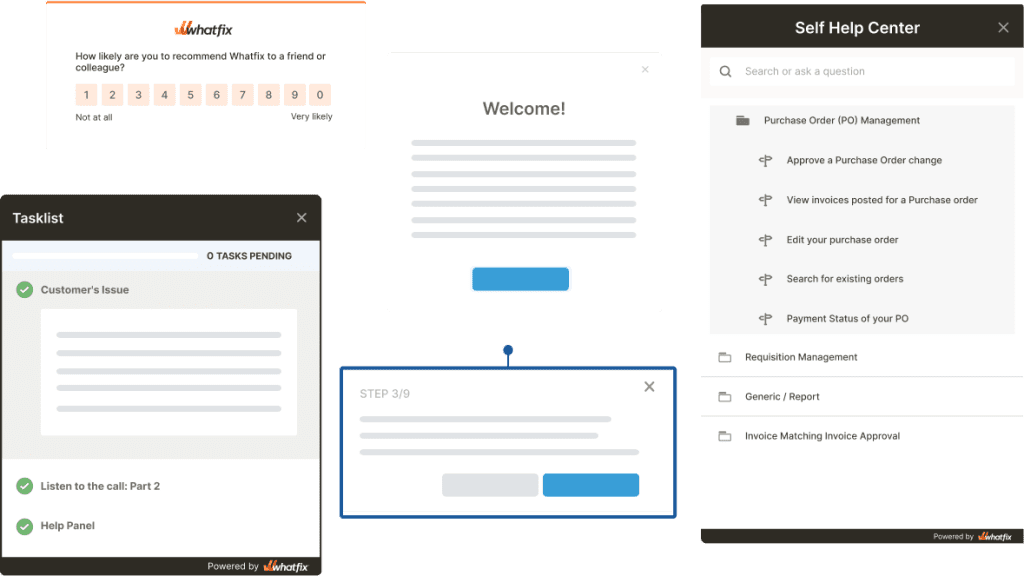
Instead of guessing how to optimize the user experience, Whatfix helps you understand how your users engage with your product, segment users based on level of engagement, and drive adoption with non-intrusive messaging – all with no-code tools that don’t rely on development and engineering resources.
1. Analyze your application’s stickiness with product analytics and user event tracking
Product analytics are the first key to building sticky products—after all, you can’t create engaging experiences without learning how your users engage with your product now and which features they use most.
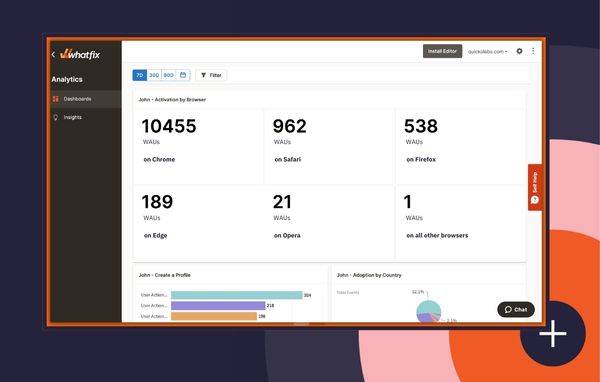
Whatfix Analytics helps product teams track user behavior throughout your application and feeds you real-time data on which elements users interact with, the actions they complete, and how they’re adopting your product’s features.
2. Create personalized, role-based onboarding flows and product tours
Depending on their niche, SaaS products usually have a wide range of uses: a photographer might use Dropbox to store images and revisions, while a student keeps track of their projects and papers there, while a corporate board might use Dropbox Paper to collaborate on documents in real-time.
The same product—different use cases. And that creates an interesting problem: how do you create an onboarding UX that’s inclusive enough to accommodate all the different user personas that’ll be trying out your product?
That’s a question we’ve been working hard to answer here at Whatfix. Whatfix is a product adoption and user onboarding tool that enables product teams to create and customize onboarding experiences so that different users get contextual product tours that explain how your product works for their specific use cases.
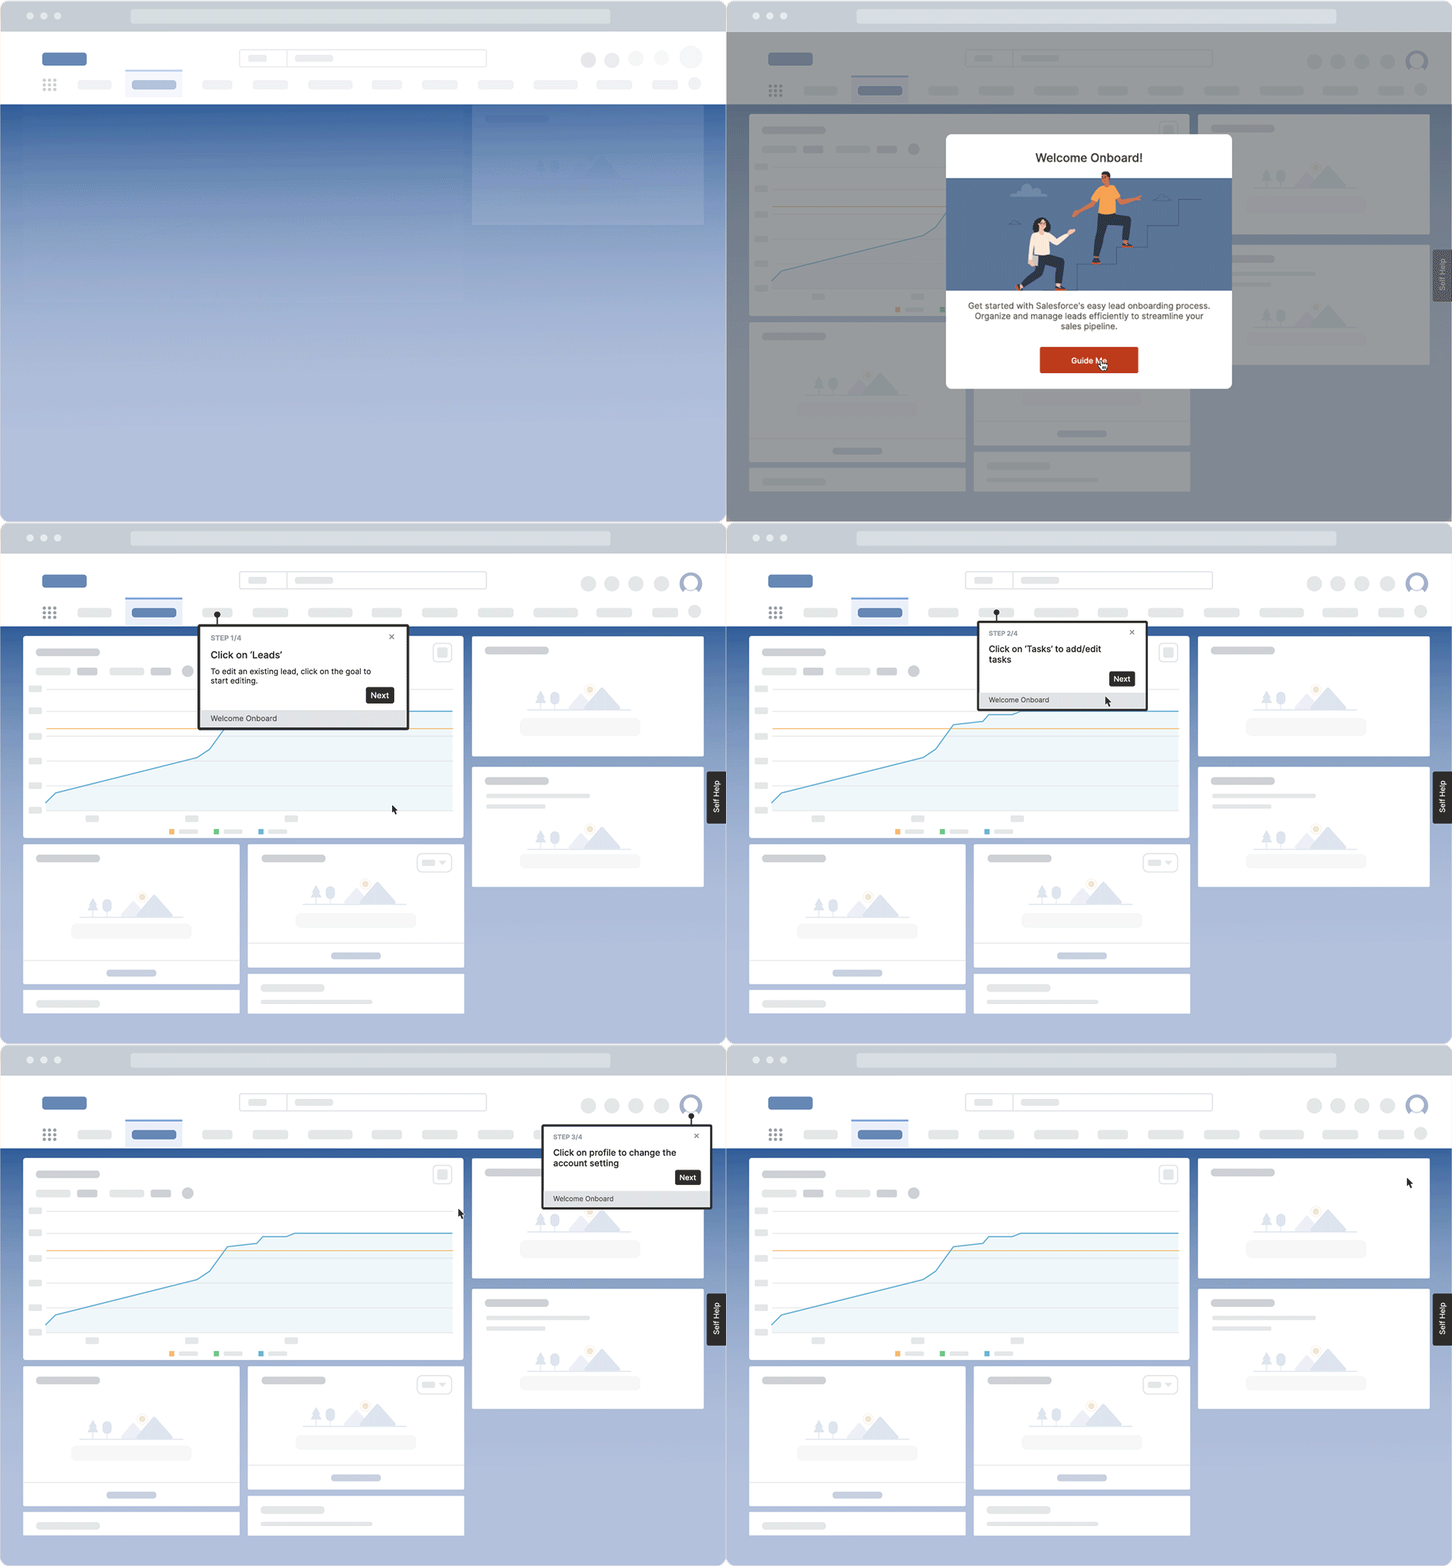
Using Whatfix, a product like Dropbox would be able to show photographers that they can catalog their images, view them in either grid or list mode, and share them with clients with a few clicks; they’d also be able to onboard undergrads by showing them how they can take notes, make a copy of a file, and restrict access to specific users with just a click.
Whatfix offers step-by-step product walkthroughs that do literally what the name says: walk users through how your product works, with the experience customized for their specific use case, whether they’re a photographer, graphic designer, writer, Vice President of Sales, or a startup founder.

3. Drive feature adoption with beacons, smart tips, and interactive guidance
But, even if you have a great product tour, it’s not a guarantee that new users will go through it—especially if you have a complicated product that needs a bit of explaining (and users can be a bit impatient, of course).
So, they skip the product tour and try to figure out your user experience. Instead of leaving that first impression up to chance, Whatfix enables you to launch and roll out non-intrusive beacons, pop-ups, and smart tips that:
- Explain how a feature works when a user hovers over it.
- Ask users to try out features they haven’t used or that you just launched.
- Announce webinars, announcements, and product updates right inside your product.
Whatfix makes it easy to slowly introduce users to your product so that you can engage them with contextual guidance and explain how features work when they want to try them out.
4. Provide real-time support with an embedded self-help wiki
A study of over 1,000 companies by SuperOffice revealed that on average, companies reply to customer queries after 12 hours and 10 minutes—that’s for the very first reply, mind you. SaaS companies perform significantly better and 21% fire off the first response within an hour.
But, mind you, every minute a user has to wait for a reply increases your churn rate drastically—in fact, 75% of customers expect help within five minutes, and 33% are not willing to wait at all.
Instead of growing your customer success team’s headcount, why not answer your users’ questions before they even ask?
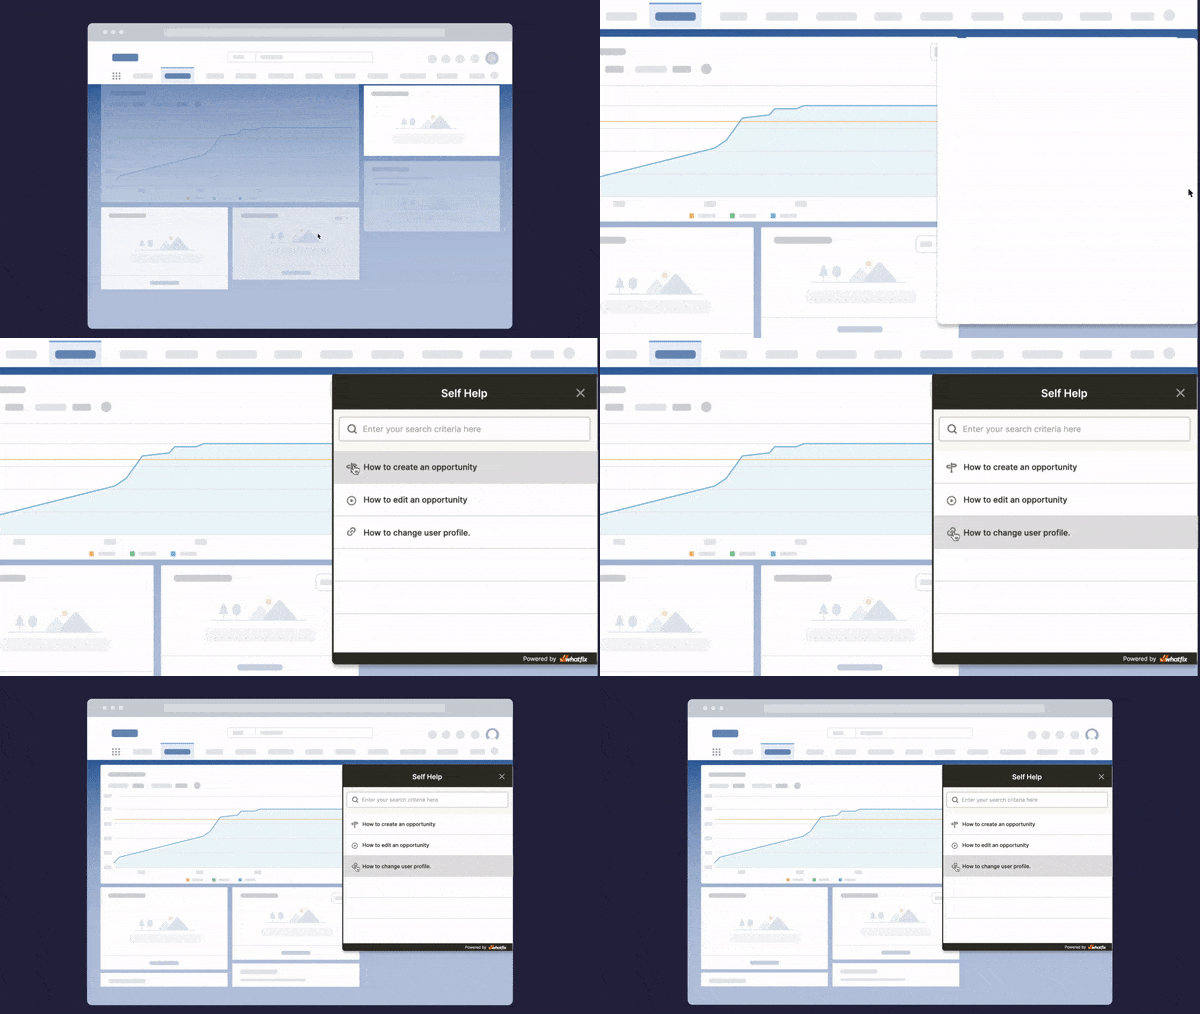
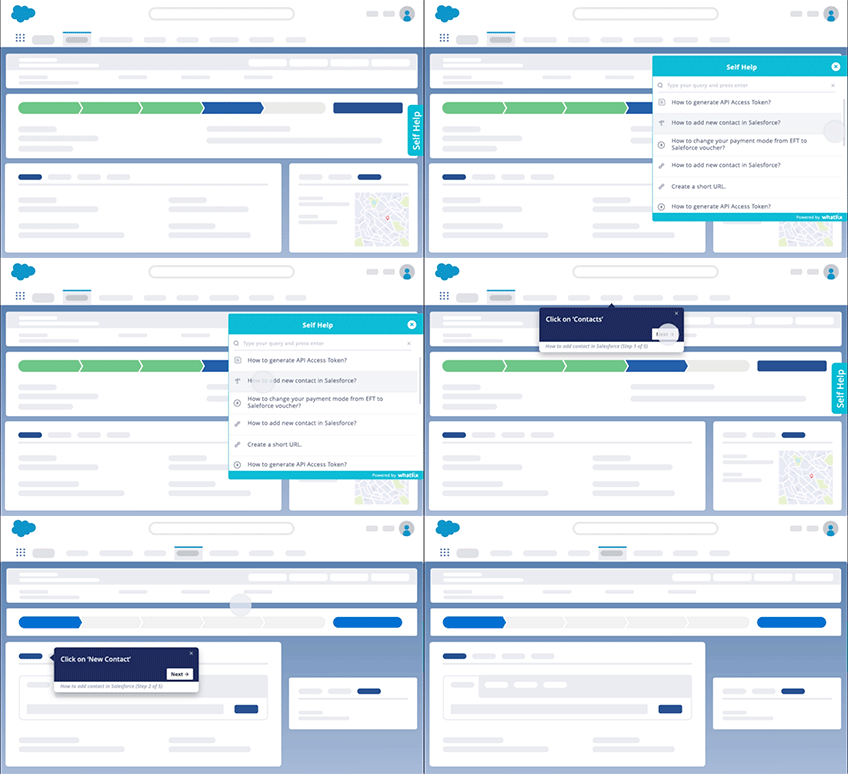
Using Whatfix, you can embed searchable customer self-support wikis your users can browse on-demand to resolve their issues right inside your product’s dashboard. As a result, you’ll cut down customer queries, answer your users’ questions proactively, identify new help content to create, improve adoption, and decrease churn.
5. Test and improve all in-app guidance and messaging to create the most effective flows
Remember, product stickiness is not a growth tactic in and of itself. It’s simply a qualitative metric showing what fraction of your users is highly engaged. What you do with that data determines your product’s growth trajectory.
To maximize product stickiness, you need to test different variants of your onboarding experiences and in-app product messaging and start asking questions such as:
- Which onboarding flow produces a higher number of engaged users?
- Does our in-app guidance increase user activation?
- Which re-engagement email campaigns, alert, and notification has reactivated inactive users the most?
- What segment of users is most likely to churn or become power users?
- Where are friction points in our user flows?
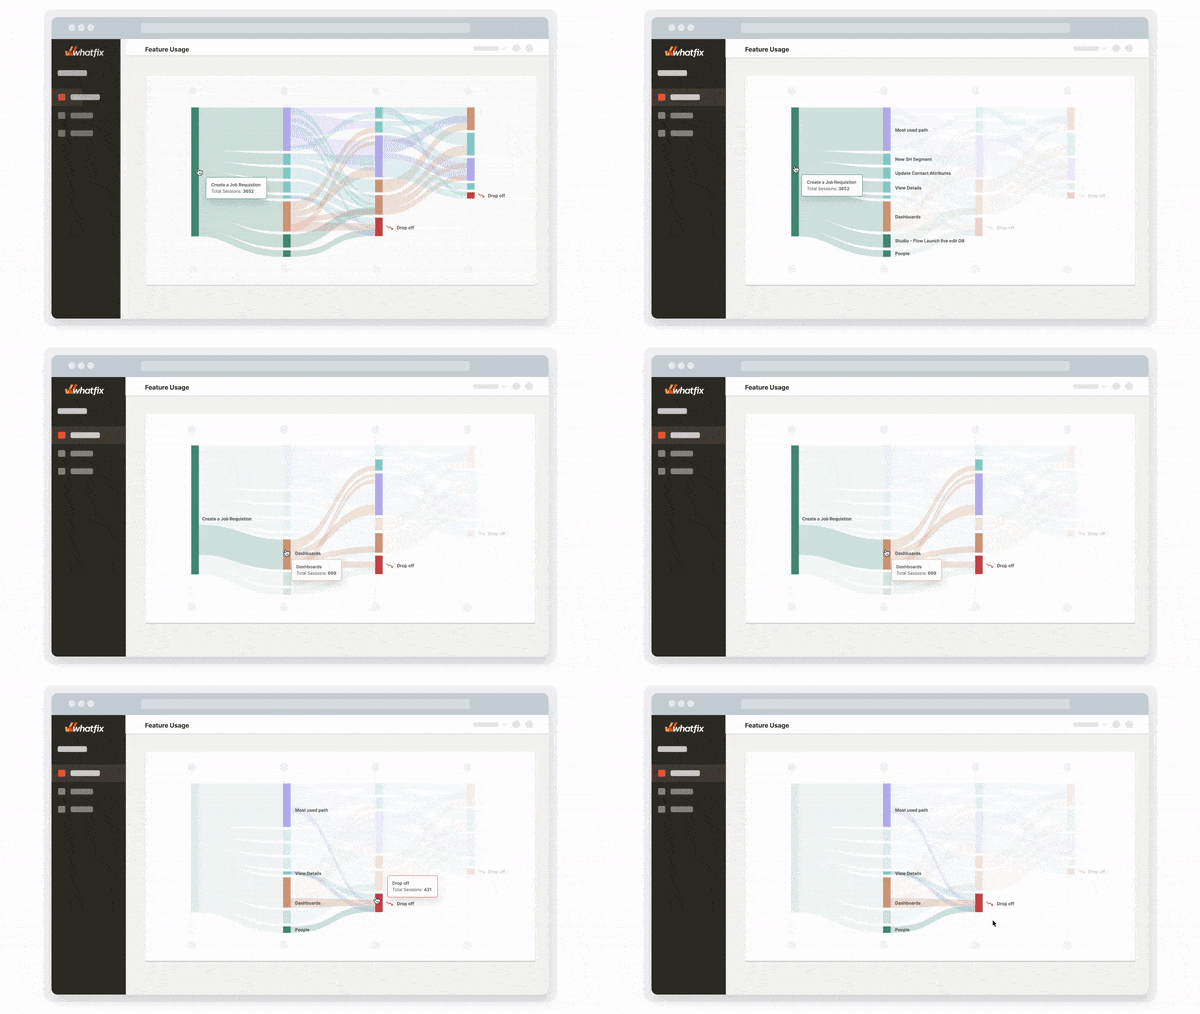
Testing aims to help you find what your most active users have in common, create campaigns that target that data point, and help you discover how to acquire and retain users efficiently.
Whatfix is designed to enable that culture of testing and you can create multiple versions of the same product tour, help docs, pop-ups, or automatically localize content to onboard users in their preferred language.
6. Collect in-app user feedback and NPS surveys
Behavior analytics helps you see patterns in how your users engage with your product, but it can only take you so far.
Product and behavior analytics only shows you how users interact with existing features and elements so that you can optimize them—it doesn’t explain which features users want you to build from scratch or to remove entirely.
So, don’t leave it up to chance—ask them directly. You need to collect user feedback.
Whatfix lets you push out open-ended feedback surveys, NPS surveys, and other types of feedback collection that ask users how likely they are to recommend your product to their network plus follow-up answers where they can explain why they love your product (or not). These surveys can be embedded in pop-ups, and you can test extensively to see your audience’s preference and gather product feedback.
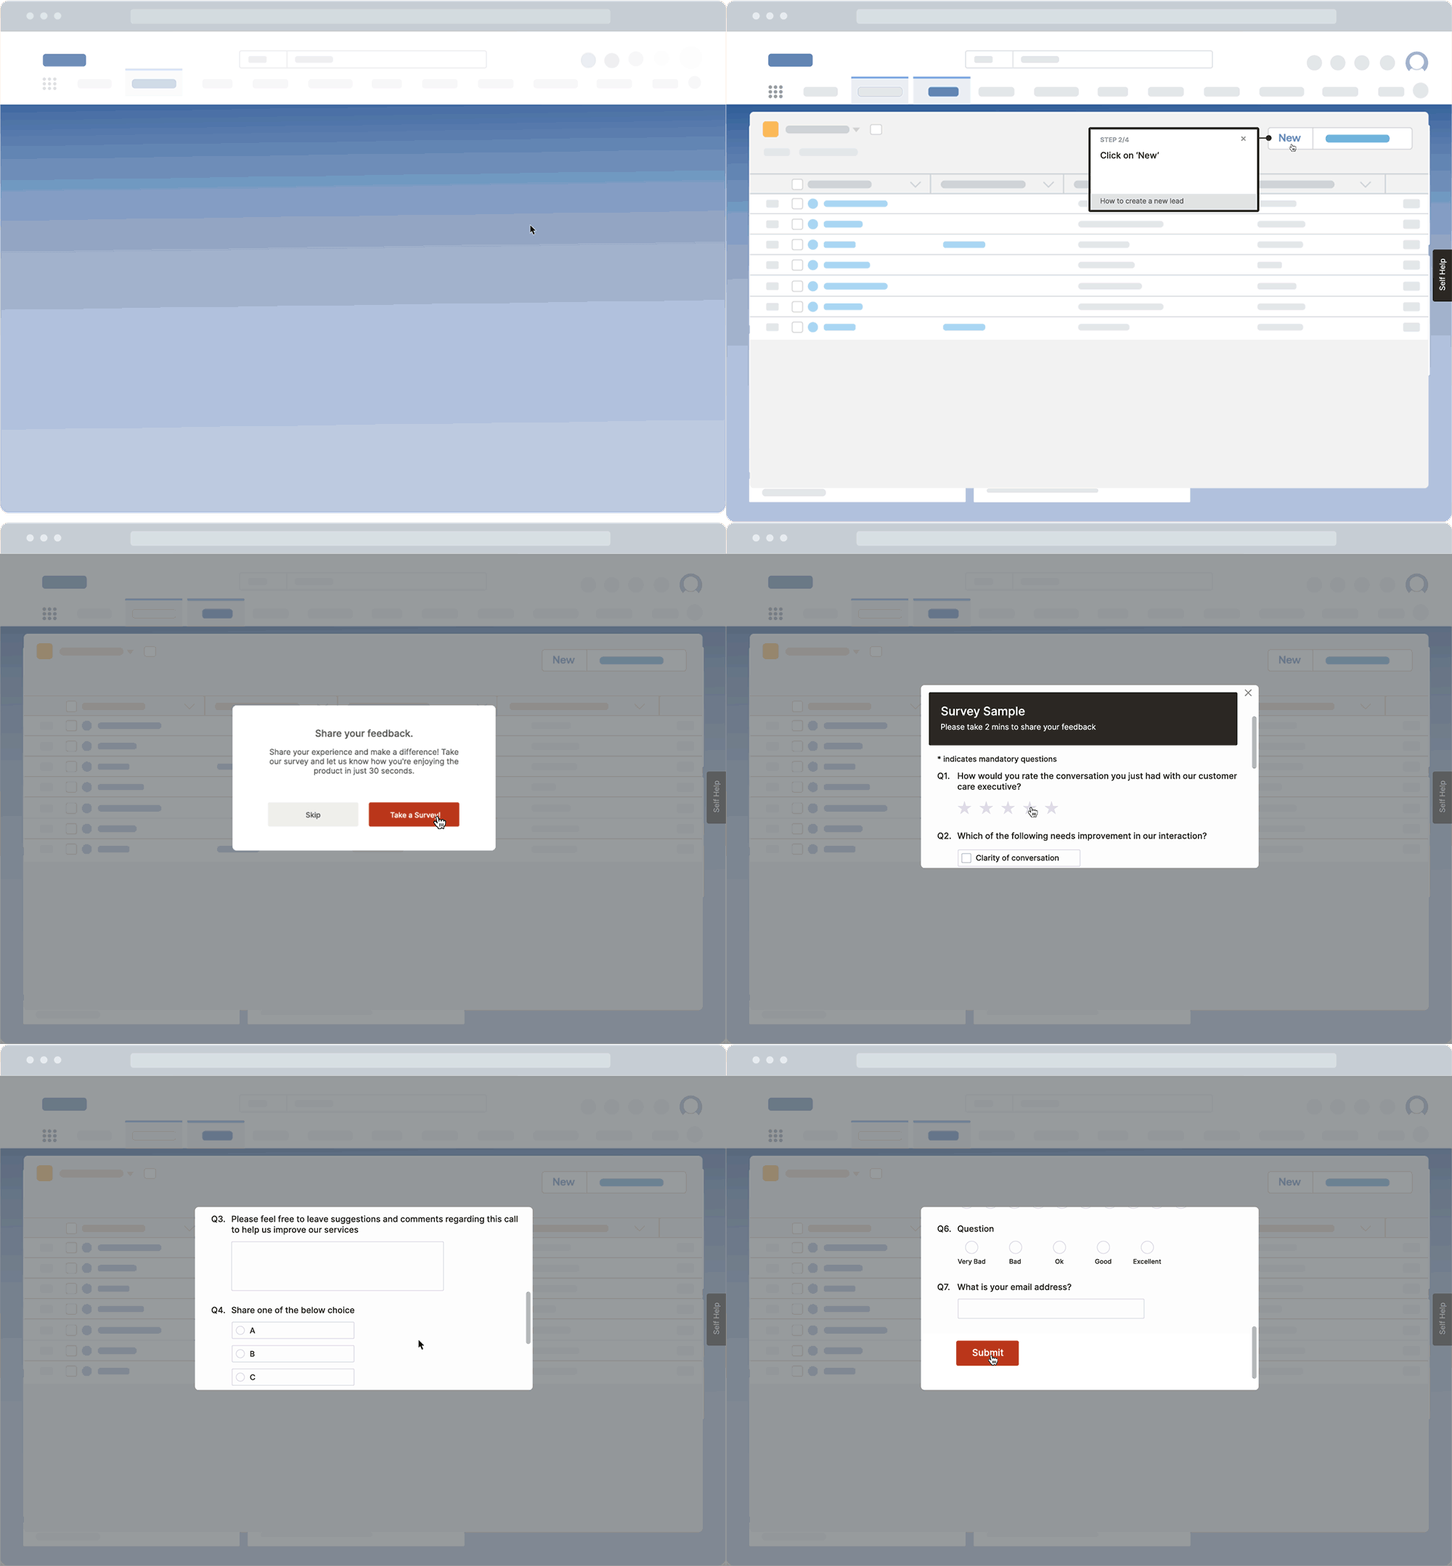
The bottom line is: Whatfix helps product managers understand how users interact with their product.
And that’s just half what our platform does: using Whatfix, you can A/B test multiple campaigns, design patterns, or UI elements to see which ones you prefer. That way, your product team can build a growth strategy built on data and create a sticky, lovable product that your users will keep returning to.
Thank you for subscribing!
