You’re a SaaS product manager and you notice an interesting trend among new sign-ups, precisely in the month of January. Your product is designed for the American market, but lately, you’ve started localizing your resources, landing pages, and UX to serve international users’ content in their preferred regional languages.
But suddenly, you notice that when international visitors land on your website, they sign up and then churn within a week…ie. they sign and in less than 2 days, they abandon their account and never return.
What do you do?
- Segment users based on their location and when they signed up (or churned).
- Identify patterns in the behavior of the underperforming cohort.
- Develop hypotheses for why they are dropping off.
- Test out your hypothesis—you can use session replays to watch recorded user sessions, change elements in your UX, or survey that cohort of users to understand where they encounter friction with your product.
You realize that the localization plugin you installed deprecates your application’s UX—it makes pages load slowly and makes your buttons unresponsive. After a few moments of rage-clicking, international users simply quit.
You can sling some code to integrate your localization plug-in with your website or find an alternative. And then, you run some A/B testing to see if UX improves for your new signups.
That’s the essence of cohort analysis—splitting users into smaller, discrete groups based on their shared characteristics so that you can investigate issues in your UX and figure out how to improve conversions.
What Is a Cohort Analysis?
In a broader sense, a cohort analysis is a behavior analytics technique where you group a variable or a property (ie. your users) into buckets that share the same characteristics before you analyze them. Your goal is to find patterns in the behavior across segments of users that can help you refine your product’s UX, improve conversions, and reduce customer churn.

What Is a Cohort?
In product analytics and growth engineering, a cohort is a group of users who share common characteristics, preferably over a certain period. For instance, they might have signed up, upgraded to a paid tier, stopped using your product, or ramped up their usage simultaneously.
That said, cohort analysis refers to grouping users who performed a particular action simultaneously. This helps you observe them closely, experiment with different growth and engagement tactics, and understand how you can improve our product for them.
The Importance of Cohort Analysis for User Retention
To understand why users engage with a product, and why users don’t, you need the right product data and metrics. A cohort analysis empowers product teams with exactly this user behavioral data to help answer questions such as:
- Who / what types of users are engaging with your application?
- Who / what types of users are NOT engaging with your application?
- When / why are users churning?
It’s easy to generate dozens of spreadsheets filled with raw product metrics that show how users interact with your product, which resources they engage with, and where they churn. Depending on the platform you use, the amount of data you can track is overwhelming but it’s just a little more than useless in its raw form.
Cohort analysis helps you group users by characteristics they share so that you can measure why they behave the same way—assessing groups instead of individual users gives you enough depth to test and either confirm or discard hypotheses that bring you closer to the answers you need.
Acquisition Cohorts vs. Behavioral Cohorts
There are two main cohort types to analyze, which are acquisition cohorts and behavioral cohorts.
Let’s explain each of these further.
1. Acquisition cohorts
Acquisition cohorts group users together based on when they first engaged with your content and resources, or when they started using your product. Acquisition cohort analysis helps product and growth engineers to investigate why a batch of users are behaving in a certain way, using when they signed up as their common denominator.
2. Behavioral cohorts
Behavioral cohorts are made of users who carried out the same (group of) actions inside your product. Let’s say you’re a growth engineer for an enterprise CRM and you want to learn how likely users are to keep using your product after importing their contacts. In that case, you can segment users who imported their contacts into one cohort and compare their conversion against the rates for the rest of your users.
How to Conduct a Cohort Analysis in 5 Steps
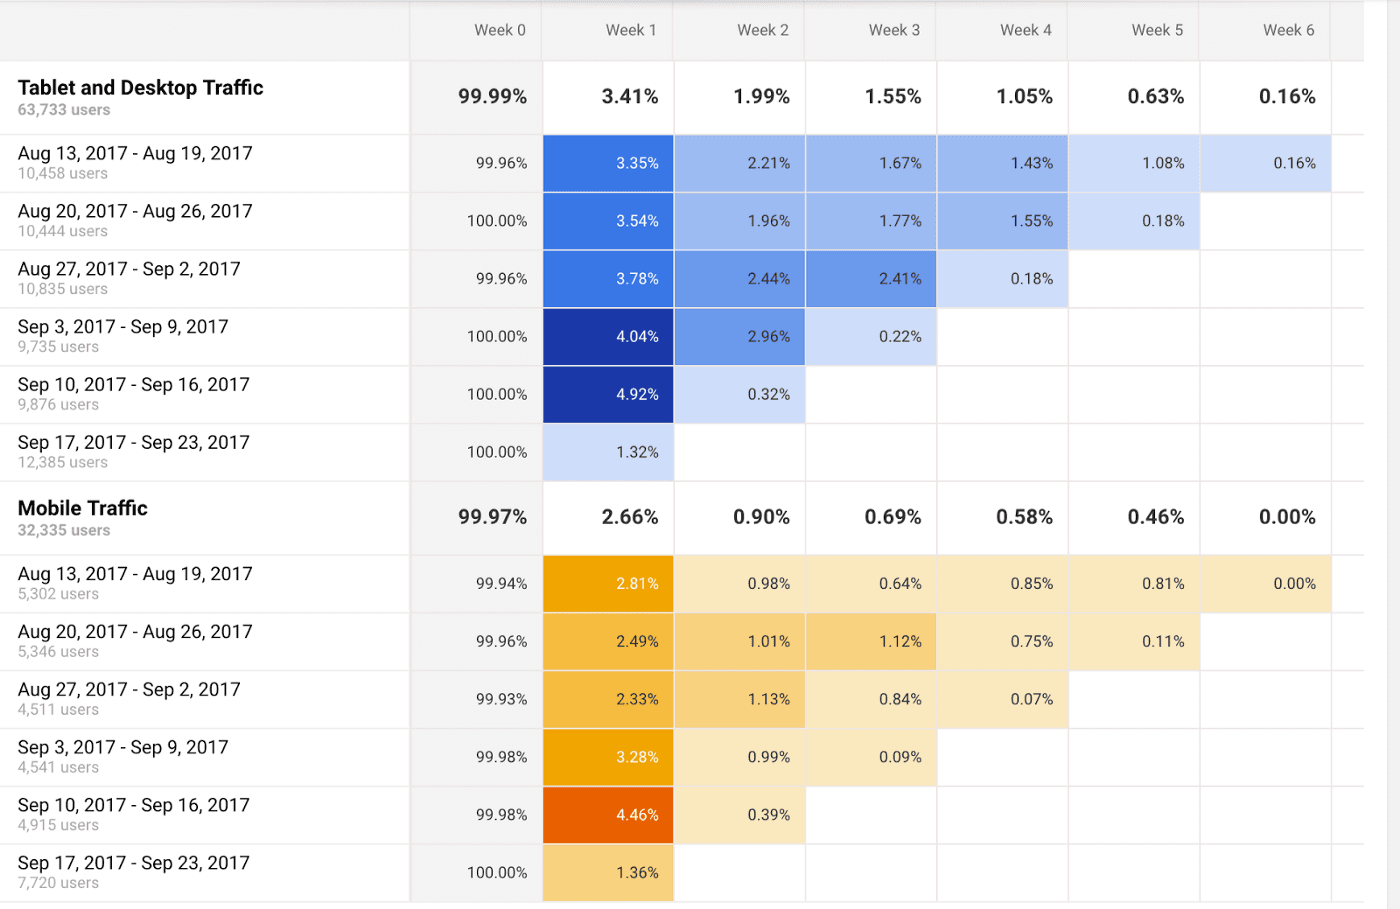
Remember, acquisition cohorts group users together based on when they signed up for your product.
It can also be used for behavioral analytics, such as tracking pricing upgrades, customer churn, and active usage against a timeline—it helps you split users up into different brackets, based on when they signed up and then to observe their behavior as time progresses.
1. Perform an acquisition cohort analysis to establish a user timeline
Remember, acquisition cohorts group users together based on when they signed up for your product.
It can also be used for behavioral analytics, such as tracking pricing upgrades, customer churn, and active usage against a timeline—it helps you split users up into different brackets, based on when they signed up and then to observe their behavior as time progresses.
2. Analyze the acquisition cohort and timeline to identify when and where user dropoffs occur
When you observe the timeline for different user cohorts, you tend to start seeing patterns such as:
- When users stop engaging actively with your product.
- Which features did they stop or never start using.
- Which types(s) of users cancel their subscriptions and when.
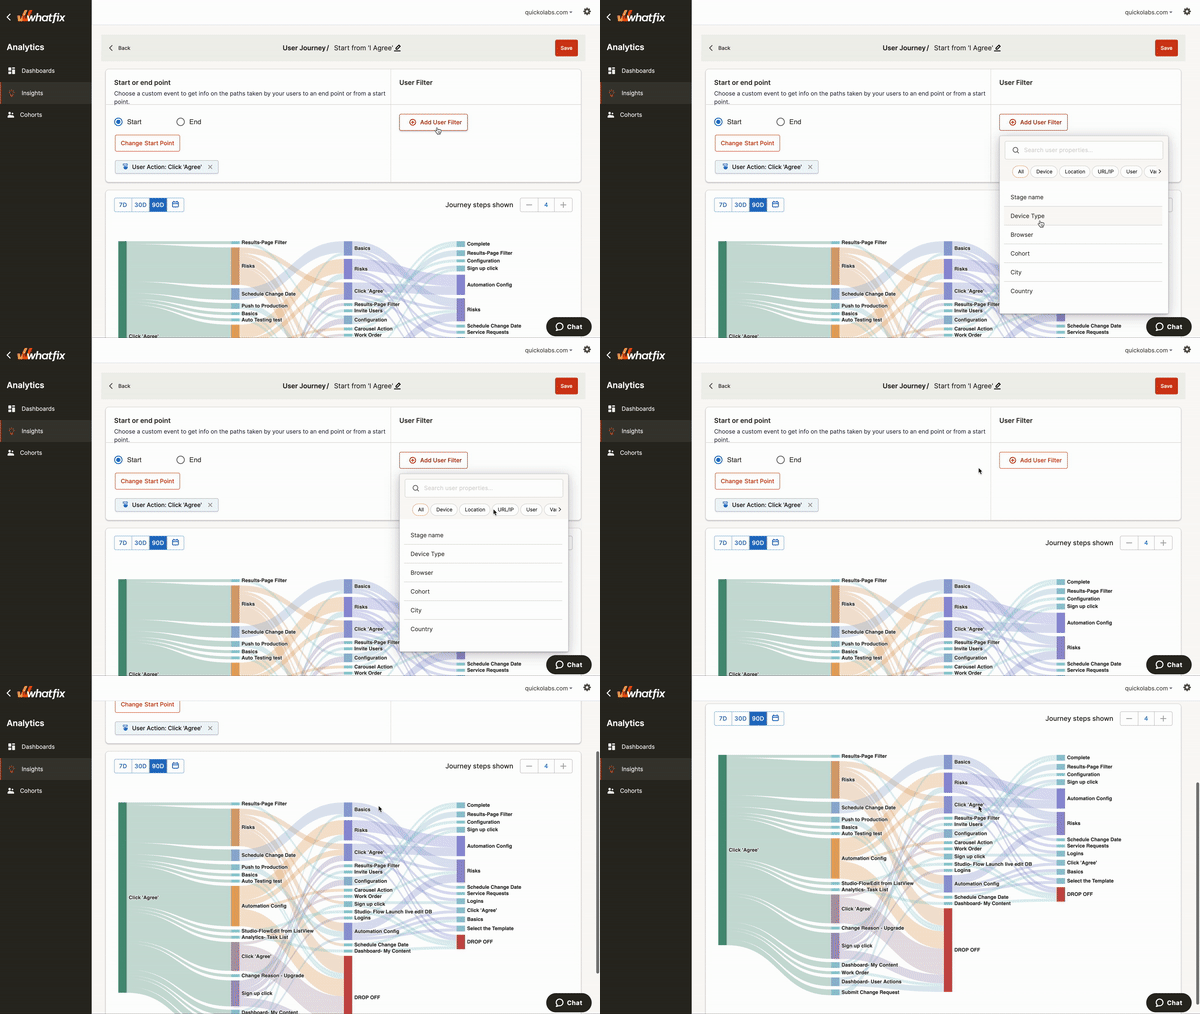
You can conduct a user path analysis to pinpoint the areas of user friction and dropoff.
3. Compare your various behavioral cohorts for different core features and user flows
The cohorts you’ve created so far are designed to help you understand changes in your users’ behavioral patterns after signing up and to understand why.
If you realize certain of your product’s features and widgets are impacted the most (i.e., not getting used), you can also generate cohorts that track how much your users engage with specific features, user flows, resources, and UX elements.
The first goal of cohort analysis is to detect an inflection point—that is, where does churn increase (or decrease) significantly? At what stage do users stop referring to this feature? Do they try it out enough during the onboarding process?
4. Create a hypothesis as to why dropoffs are occurring and test it
There are lots of places you can look for clues to make a hypothesis—recent changes to your product’s onboarding UX, new plugins, changes to your codebase, a user’s location, landing page redesigns, etc. Essentially, any change to your product experience at the particular point where dropoffs started or accelerated.
5. Collect user data, analyze results, and repeat
Cohort analysis is not an end in itself—it’s just a step that feeds into A/B testing. You want to find a connection between churn, upgrades, dropoffs, onboarding completion, or some other user engagement metrics and a particular set of variable(s) in your product.
Once you can establish a relationship between your product’s core metrics and a variable, you can change the latter and test to see if conditions improve.
If nothing changes, you cross out your initial assumption, circle back to step four and keep experimenting until you can isolate exactly what’s impacting your UX experience and adoption rates.
3 Tools for Performing Cohort Analysis
Here are a few of the best, most comprehensive product analytics tools teams can use to perform a user cohort analysis, track product metrics, and make data-driven decisions.

1. Whatfix
Whatfix is a digital adoption platform and product analytics software that enables product managers to understand user behavior and take action, all in a no-code environment. Its technology is centered around three core concepts, ‘Analyze, Build, Deliver.’
With Whatfix Analytics, product managers can implement an event-tracking analytics system that captures and analyzes user behavior. Its analytics features include user action tracking, funnel analysis, trend insights, and cohort analysis on various types of in-app behavior.
Understanding user behavior such as common user flows, onboarding completion, time-to-value, feature adoption, etc., will help you:
- Segment users into cohorts for better analysis,
- Conduct funnel analysis to understand the steps users take before completing a specific action
- Uncover patterns and trends in your user engagement data
- Recommend the right content and the ideal format for your users
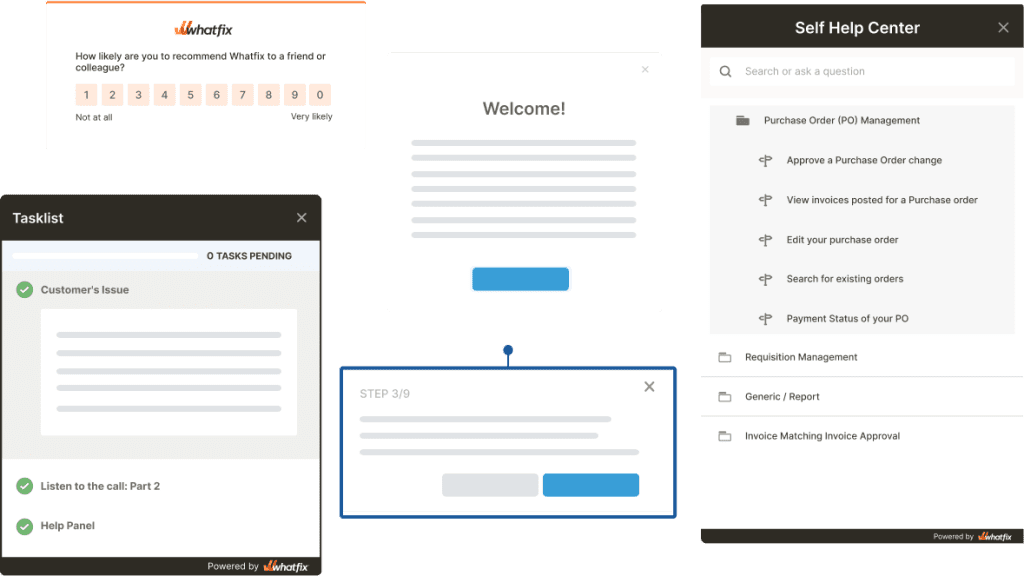
With this data, product managers are empowered to take action with Whatfix’s no-code editor that allows them to create and publish in-app content such as interactive walkthroughs, product tours, task lists, smart tips, hotspots, pop-up messages, self-help wikis, and more.
Product managers then repeat the cycle by collecting data on the new user flows and changes to see its impact. Whatfix also provides in-app feedback and survey features to gather additional, qualitative data to create better, more user-centric products.


2. Appcues
Appcues helps product teams build personalized experiences with onboarding tools that nudge users in the right direction, user flows that coaches customers and helps them stick to your product, and a no-code interface that works in your browser.
- Show users unique help and onboarding resources depending on their pricing tier, company size, preferences, or usage
- Encourage hands-on onboarding with checklists
- Announce new features and highlight unused tools with non-intrusive cues
- Build once experience and roll it out for your web and mobile apps alike, and
- Collect feedback with NPS surveys you can design without writing one line of code
On the downside, it’s quite expensive compared to the alternatives and you need custom CSS and Javascript libraries if you want to customize UI elements beyond the basics.


3. Google Analytics
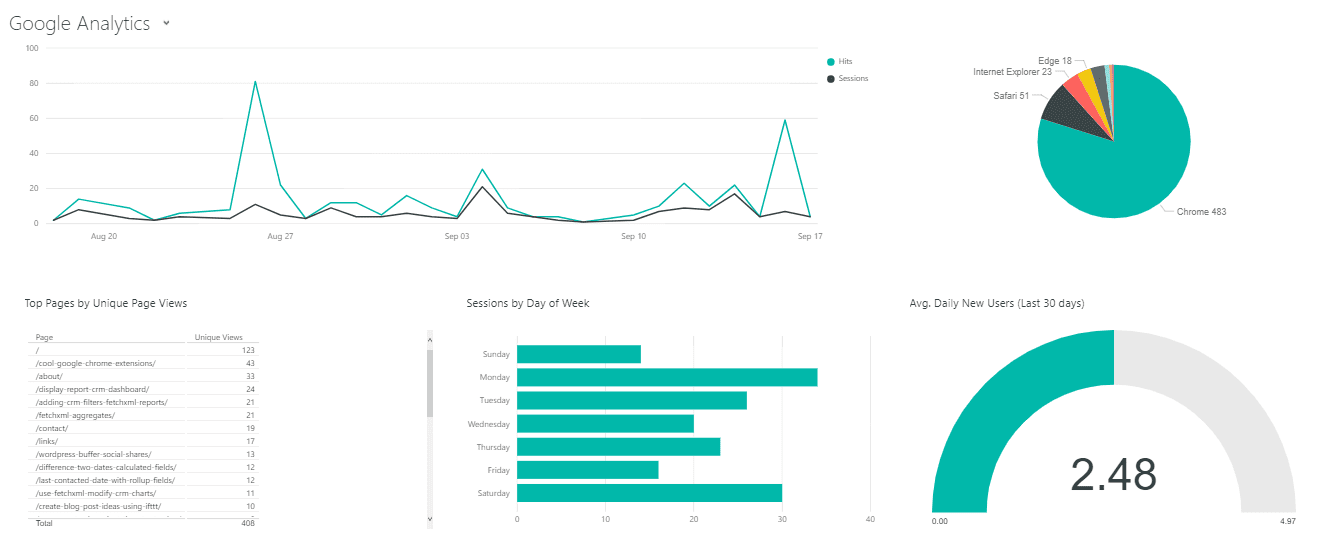
Unlike our previous two entries, Google offers an extremely powerful analytics engine that works differently from a typical product analytics platform. First off, Google Analytics is primarily for marketing—it helps growth teams allocate their PPC budget, and determine the ROI of their organic content efforts, it’s essentially free, works across mobile and web devices and you don’t need to integrate it technically.
But, Google Analytics’ biggest benefit is also a downside: namely, it’s a little too powerful that it feels overwhelming —there’s an endless collection of dashboards, reports, graphs, and engagement metrics you can edit and tweak—so much so that if you’re not careful, it’s easy to get obsessed with vanity metrics while your user experience suffers.
This brings us to Google Analytics’ second major issue—it’s designed for marketing by default, not product and growth use cases. As a result, it’s impossible to get the level of granular access that helps you understand which actions your users complete, for how long, and their general behavior patterns.
Finally, Google Analytics starts off free but once you’re ready to upgrade, pricing starts at $150k annually.

With a no-code platform like Whatfix, product teams can capture, benchmark, and improve core product metrics with out the need for engineering support. Take action on your cohort analysis and other product-related data by creating in-app guidance and support content that appears natively in your app, with your product’s branding.
You can learn more about Whatfix Analytics now!
Thank you for subscribing!


