What Is Product Analytics? Everything You Need to Know (2024)
- Published:
- Updated: June 27, 2024

Building a great product is a delicate balancing act. Whether you’re a scrappy five-person startup or a large enterprise, the process looks something like this:
- Develop and launch an MVP of your product to a community of users
- Collect data and feedback on how your customers are using your product
- Make data-driven product roadmap decisions
- Repeat the cycle as your product grows
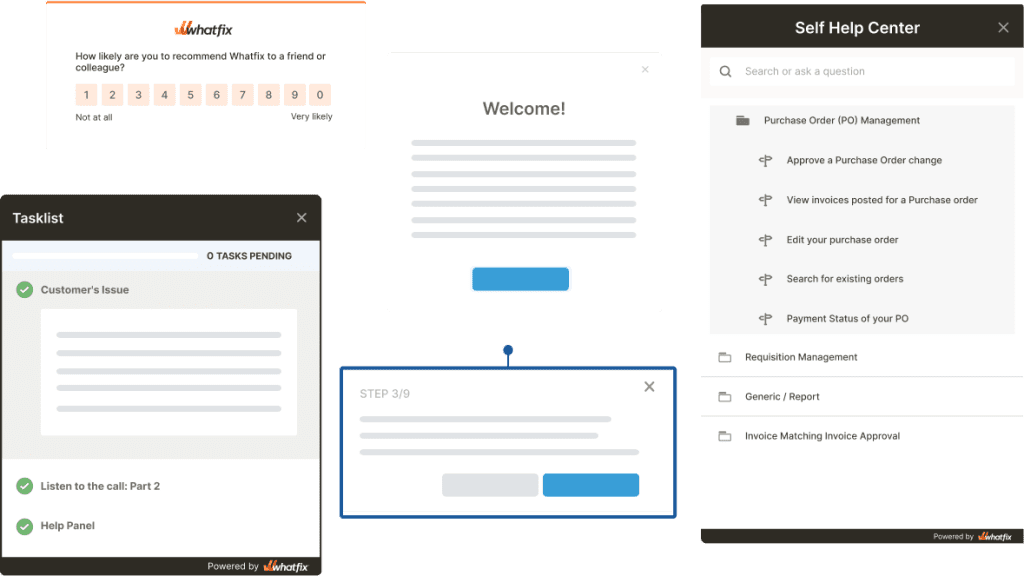
Product managers should take every opportunity to collect product data – from customer interviews, NPS surveys, in-app behavior analytics, and more. You can’t build a great product without a detailed look into how your customers use your product(s), their problems, the challenges they’re facing, and how you can improve the user experience.
What Is Product Analytics?
Product analytics is the process of tracking, analyzing, and studying how users engage with a digital product or service. It enables product managers to capture, visualize, and analyze product usage and user behavior data such as user journeys, cohort analysis, funnel analysis, and more to understand adoption, engagement, and overall experience. Product teams use these insights to make data-driven decisions to improve their products and services.

Benefits of Product Analytics
Product analytics aims to help product teams understand how people use their digital products to improve their products. Whether a product manager or an engineer, product analytics provides a framework to help make data-driven decisions and is the first step towards building better, customer-centric products.
You need to understand your customers’ usage patterns, the (unanticipated) challenges they may be facing with your product, and any features that need a little more boost to work better — and then build them.
But you can’t, if you don’t understand how a user interacts with your products and resources.
1. Create a more valuable product and an intuitive product experience
Product managers look at product usage, patterns, and other user-generated engagement events to understand how they’re product or service is being used, how its being adoption, and how to build overall better products and experiences.
Product analytics empower teams to capture, monitor, visualize, analyze, and test user engagement and behavior with real-time data. This allows product teams to create optimal user experiences, identify dropoff or user friction points, map user flows, build user cohorts, track customer conversion events, measure feature adoption, and more.
These product and user behavior analytics enables product teams to make data-driven decisions to build better products with more engaging experiences and drive actual user outcomes.
An intuitive product experience works how your users expect it. It’s not magic; you simply track their usage patterns and engagement metrics to determine what your users want.
Here’s a simple checklist to leverage analytics in your product development:
- Which elements do your customers use most? Make them prominent, so they’re easy to find.
- What are the components users hardly ever interact with? Remove them.
- Determine which features customers want but are not urgent — put them on a backlog and slowly work towards them.
- Are there any features that customers often request? Make them a priority & ship them fast.
Product analytics helps you build what customers want by watching how they use what you built already.
2. Uncover areas of user friction and product pain points
No matter how early your product or company is, creating a valuable user experience should be at the top of your priorities. After all, only 1 out of 26 customers will ever reach out about a poor experience, and the rest (96.1%) will just churn.
By the time users reach out to your customer success team and are still working on their pain points, you would have already lost; you already lost many users who think your product wasn’t worth it.
Examples of product friction points include:
- High level of cart abandonment
- Rage clicks
- Finding documentation to support questions
- Clunky sign-up or check-out process
Product analytics help you understand the discovery process, pain points customers experience before they create support tickets or churn, etc.
Customer service can help you understand your users’ stated problems. Still, product analytics will (in a way) help you look over your customers’ shoulders to see how they engage with your products in real-time and how you can improve the user experience to reduce customer churn.
3. Make data-driven product roadmap decisions
A product roadmap is a visual representation of the features you want to build into your product, in the order, they will be built. A roadmap shows a product development team what to build now, what next, and what comes up later.
When customers request certain features or changes to your product, your development team creates a task & puts it somewhere on the roadmap, depending on the priority. How then do you figure out which priority to ship first?
For instance, a SaaS company may be wondering whether to focus on the offline access their users have been requesting for months, or to concentrate on building stronger account security, or even an entirely new feature?
If your product management and development teams don’t prioritize features according to user demand, your customer satisfaction, user retention, and revenues may (read: will) start dropping.
It isn’t a bad idea to poll users to figure out which features they want more urgently.
But product analytics will help you assess how your customers use your product, their use cases, their interaction patterns, and the challenges they encounter so that you can judge which features will improve their user experience immediately to prioritize those in your roadmap.
Product teams are empowered then to make decisions backed by product analytics data – and typically, a data-backed roadmap decision-making framework provides a path forward when your team may be uncertain about what features to work on.
4. Understand how users interact with your product
Product teams often have many questions about how their customers and users engage and interact with their products. A few examples of these questions include:
- What are my users’ friction points?
- What is the time-to-value for my users?
- What is my free-to-paid conversion rate?
- Who are my most valuable customers?
- What type of users are engaged, and what kind are churning?
- What new features are being adopted, and which need additional awareness marketing and end-user training?
- How long does it take my users to achieve their “aha!” moment?
Let’s look at an example – your product’s conversion rate last month was 45% higher than the previous month. Of course, you want to figure out what changed so you can double down on it, right?
You can either:
- Take a guess (which will most likely be wrong)
- Look at usage patterns to see why and how your customers are getting more value out of your product — using a product analytics platform
Now, let’s be clear that product analytics tools don’t help you spy on your customers. They simply observe usage patterns to see how users interact with your resources. Those patterns will help you learn how to enrich your products, reduce friction, simplify your UX, build features your customers will use, and increase your product adoption.
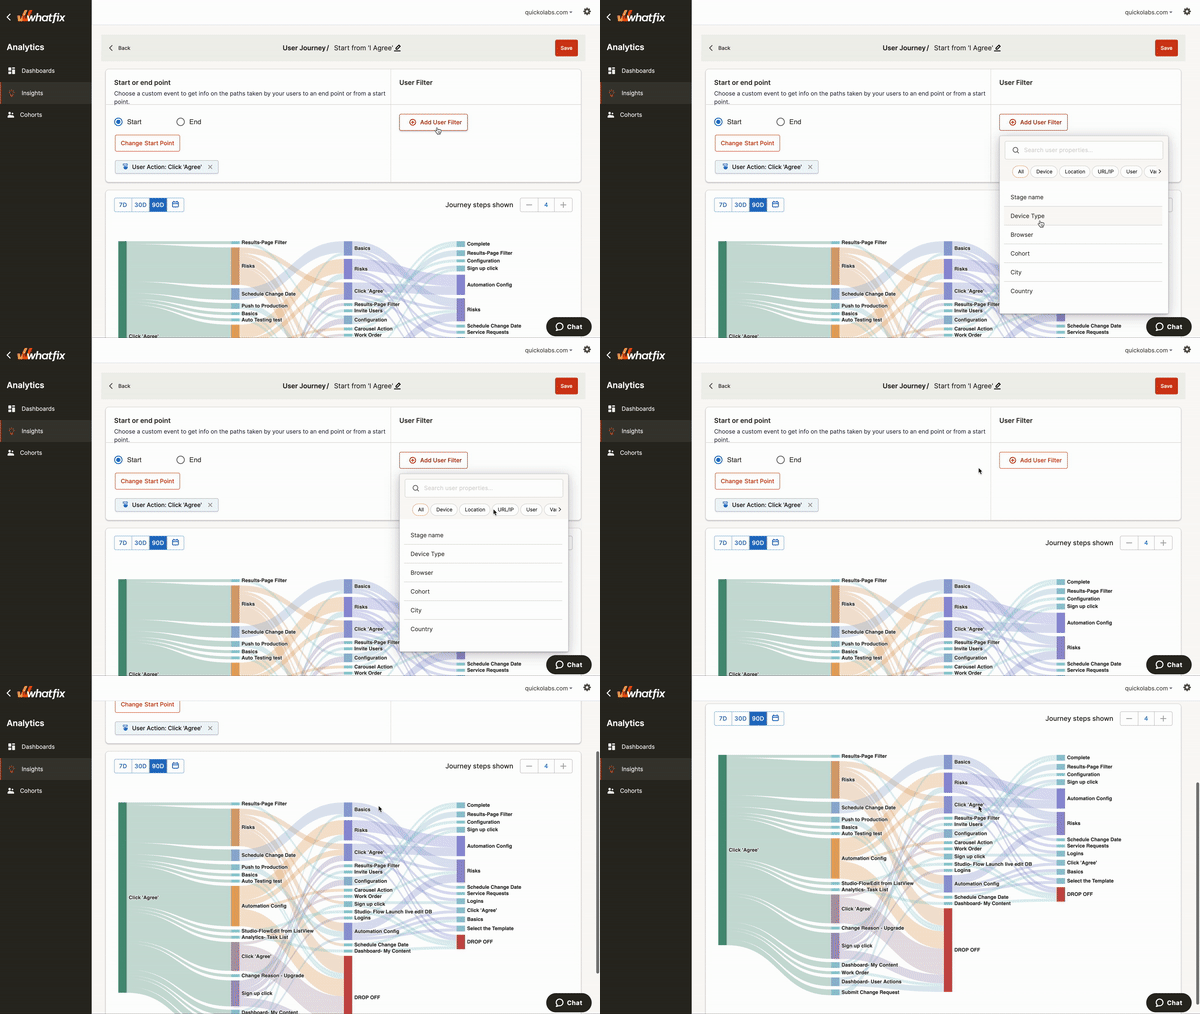
With a tool like Whatfix Analytics, product teams are empowered to track user journeys to analyze user flows, where users are experiencing pain points, and identify product areas to test and improve.
Analyze user behavior and track product usage with Whatfix Analytics
Enable your product managers to easily track and analyze user behavior and product usage with Whatfix Analytics, a no-code event tracking solution. With Whatfix Analytics, capture all user actions without engineering support, understand product usage, identify dropoff areas, understand feature adoption, map user journeys, build user cohorts, and make data-driven product decisions.
Example of Product Analytics Metrics
Product managers across industries use product analytics to capture insights into their product’s experience and how users engage with it.
A few common examples of how companies are using product analytics include:
1. Trend analysis
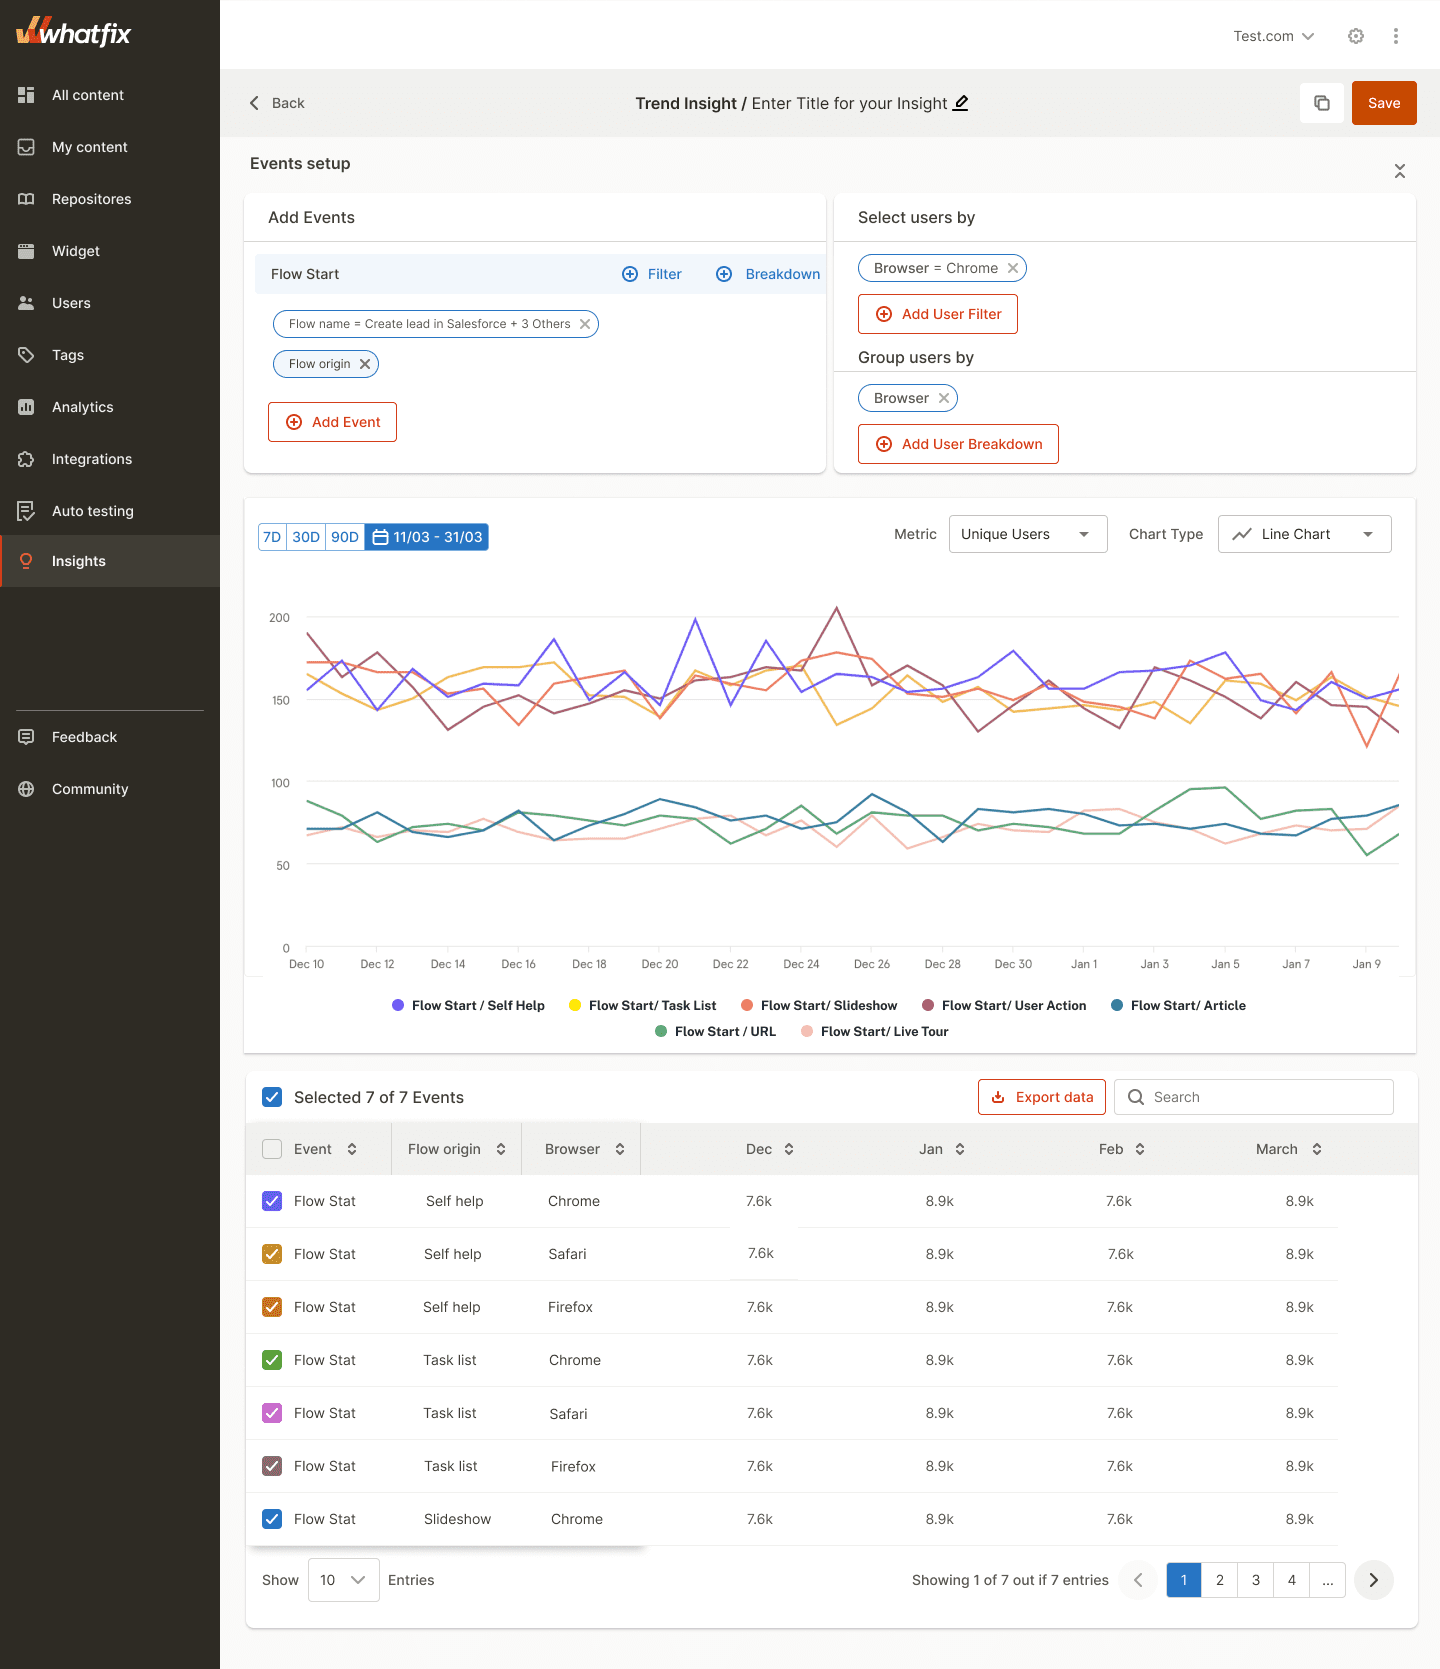
Instead of studying how individual users engage with your product, trend analysis refers to when you collect lots of data across a wide range of users. The goal is to find patterns in this data to help predict future behavior and build products with this data in mind.
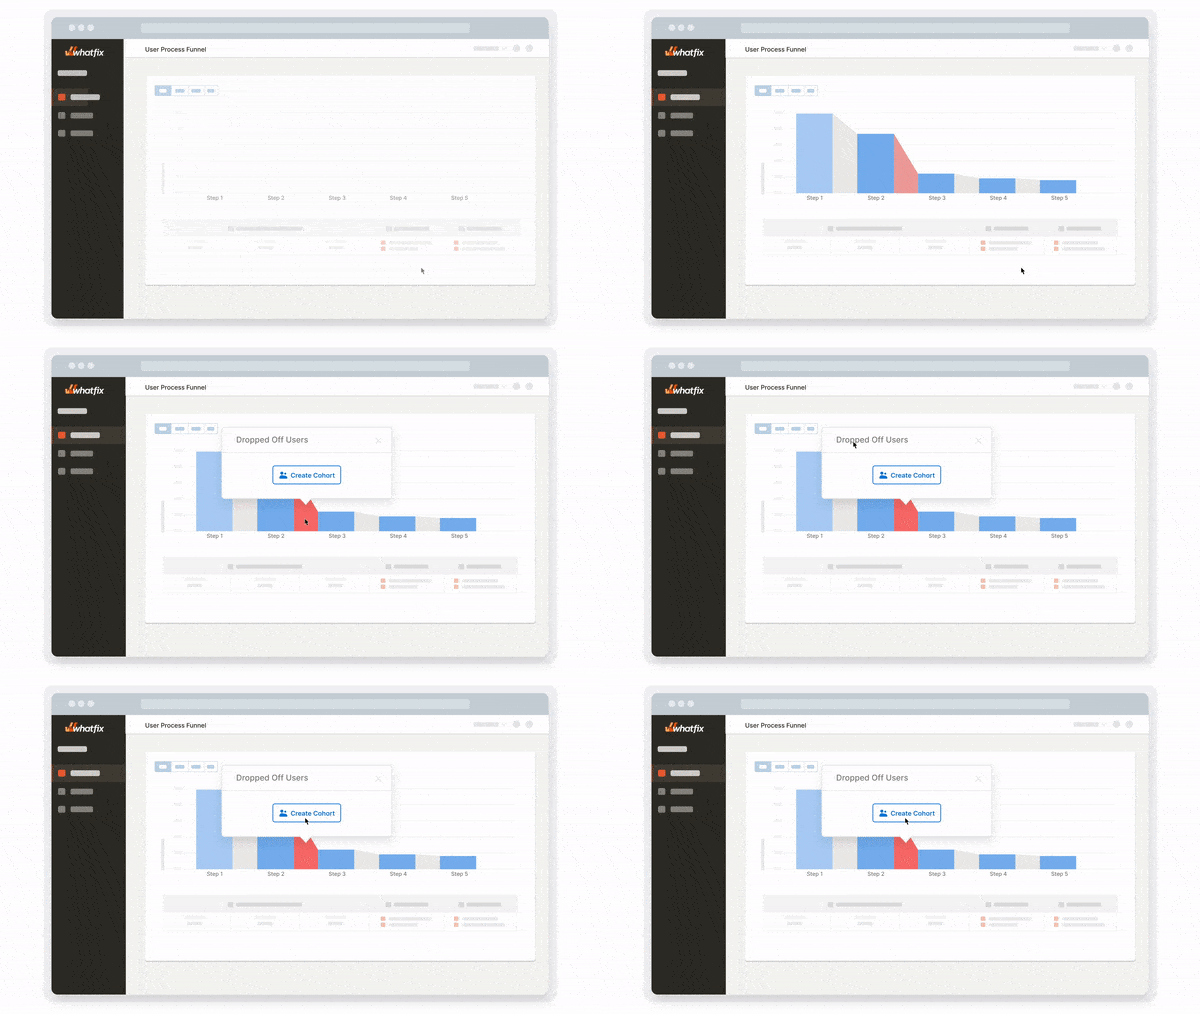
At its core, a trend analysis such as a funnel analysis provides direction for product teams based upon what market traits and buyer persona characteristics are uncovered by product analytics.
2. Journey analysis
Journey analysis or user journey mapping simply tracks the path users take to reach their goal in your product.
Journey mapping helps product management and development teams determine the main features your users engage with and the elements they must interact with to get through to them.
3. Attribution analysis
In our product management context, attribution refers to giving a feature credit for a pattern or a change you’ve observed in your product usage and your customers’ engagement.
For instance, if you remove your paywall or reduce pricing and conversions jump 30%, you can easily infer that more users are signing up because they have to pay less.
Attribution helps you tie an outcome to a particular feature or a change you made in your product. That way, you can reverse bad trends and optimize features that customers approve of.
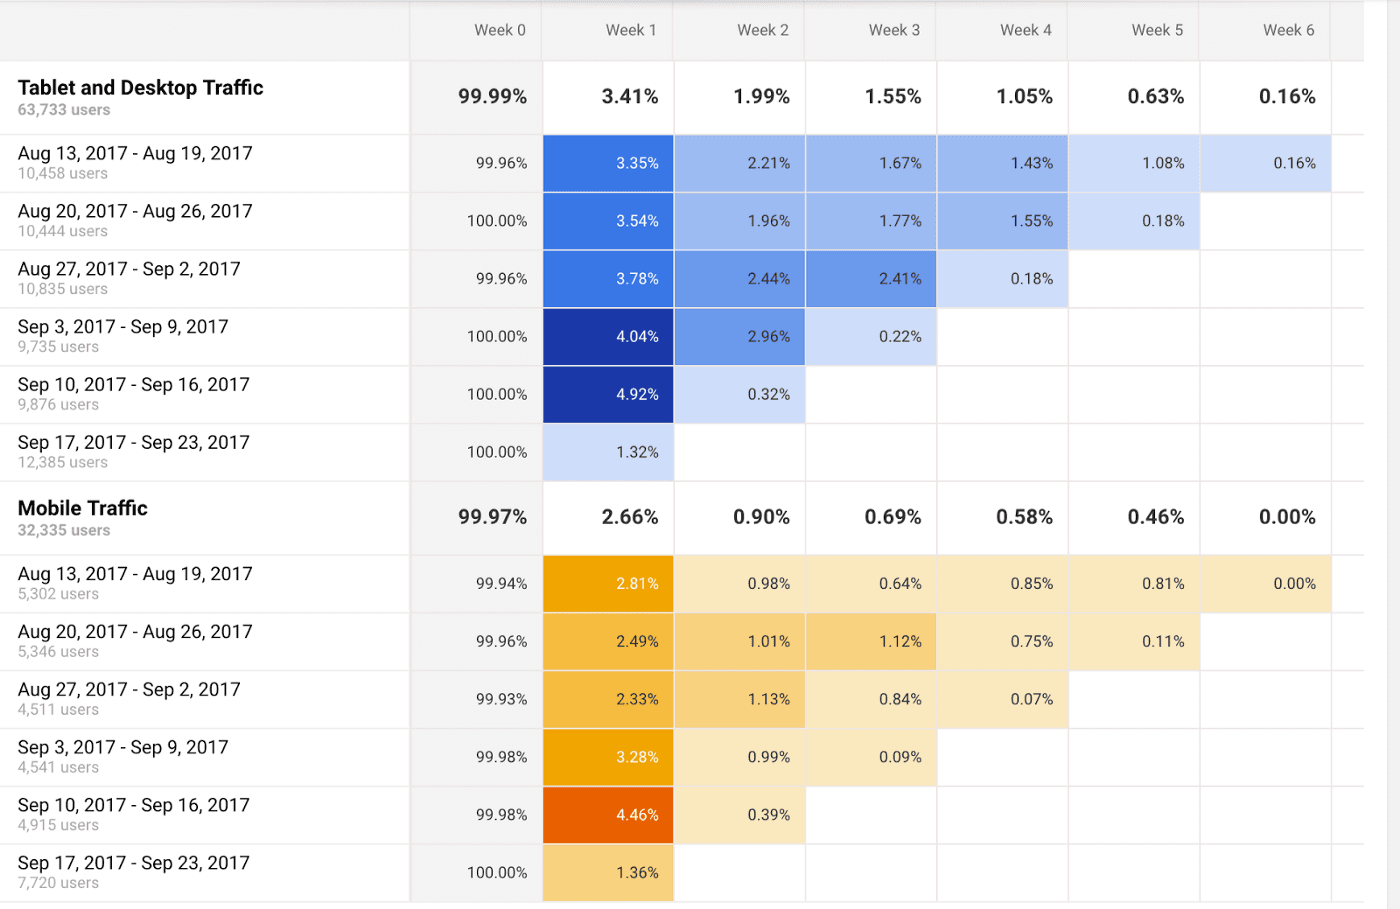
4. Cohort analysis
A cohort is a group of users that shares a common attribute. For example, you can segment users into cohorts based on criteria such as:
- When they signed up
- The pricing tier they’re subscribed to
- The country, region, or location they’re based in,
- How often do they use your product, i.e. usage metrics, etc.
Users with identical or overlapping behaviors often share the same needs, and cohort analysis helps you identify how certain groups of customers leverage your product so that you can solve pain points for your most valuable users.
What Roles Use Product Analytics?
Product analytics helps engineers, marketers, developers, and designers gauge customer satisfaction, inspect campaigns, optimize resources, and create offers tailored to your users’ pain points.
1. Product managers
A product manager defines what users want, connects those envisioned features to a company’s bigger goals (such as revenue, growth, etc.), and prioritizes these features to ensure the most profitable are built first. All that work requires knowing how your users’ usage patterns, engagement, and satisfaction with what you have already built.
Product managers also work on creating product roadmaps, monitoring product usage and conversion rates, and work with user experience teams on creating in-app experiences to improve user flows.
2. Product marketers
Products marketers invest significantly more into analytics, attribution, and reporting that shows your most effective channels and how to double down on those. They create user personas using behavior analytics and make data-driven decisions on growth marketing campaigns.
3. Developers and engineers
An organization’s developers do the heavy lifting, turning ideas on a product roadmap into usable features. Product analytics helps developers and engineers determine how to approach the development process to decide which platforms and tools to use, ship products fast, and keep iterating even faster.
4. UX designers
UX designers use product analytics to assess users’ engagement with their product(s). When you figure out how users fit your products into their workflow, it’s easier to build intuitive features that fit their workflow.
How to Implement a Product Analytics Strategy
It’s not enough to simply sign up for a product analytics tool, hook it up with your product, check out a few reports now and then, and send them to the rest of your team.
You need a strategy — a repeatable, scalable sequence of tasks, processes, and rituals — that will integrate product analytics into your product development.
A product analytics strategy will help you (and your product stakeholders) cultivate a system for using product analytics to find how to optimize your product and build on that feedback to ship better features.
Here are a few steps to get started with product analytics:
1. Choose the right product analytics platform
The success of your product analytics strategy is hinged on the tools you use, how seamlessly it syncs with the rest of your product management stack, and how it helps you make decisions with data. So, it’s crucial you choose the right product analytics software.
An ideal product analytics tool should be flexible enough to use on small projects where you’re tracking dozens of daily interactions and scalable enough to grow with your product.
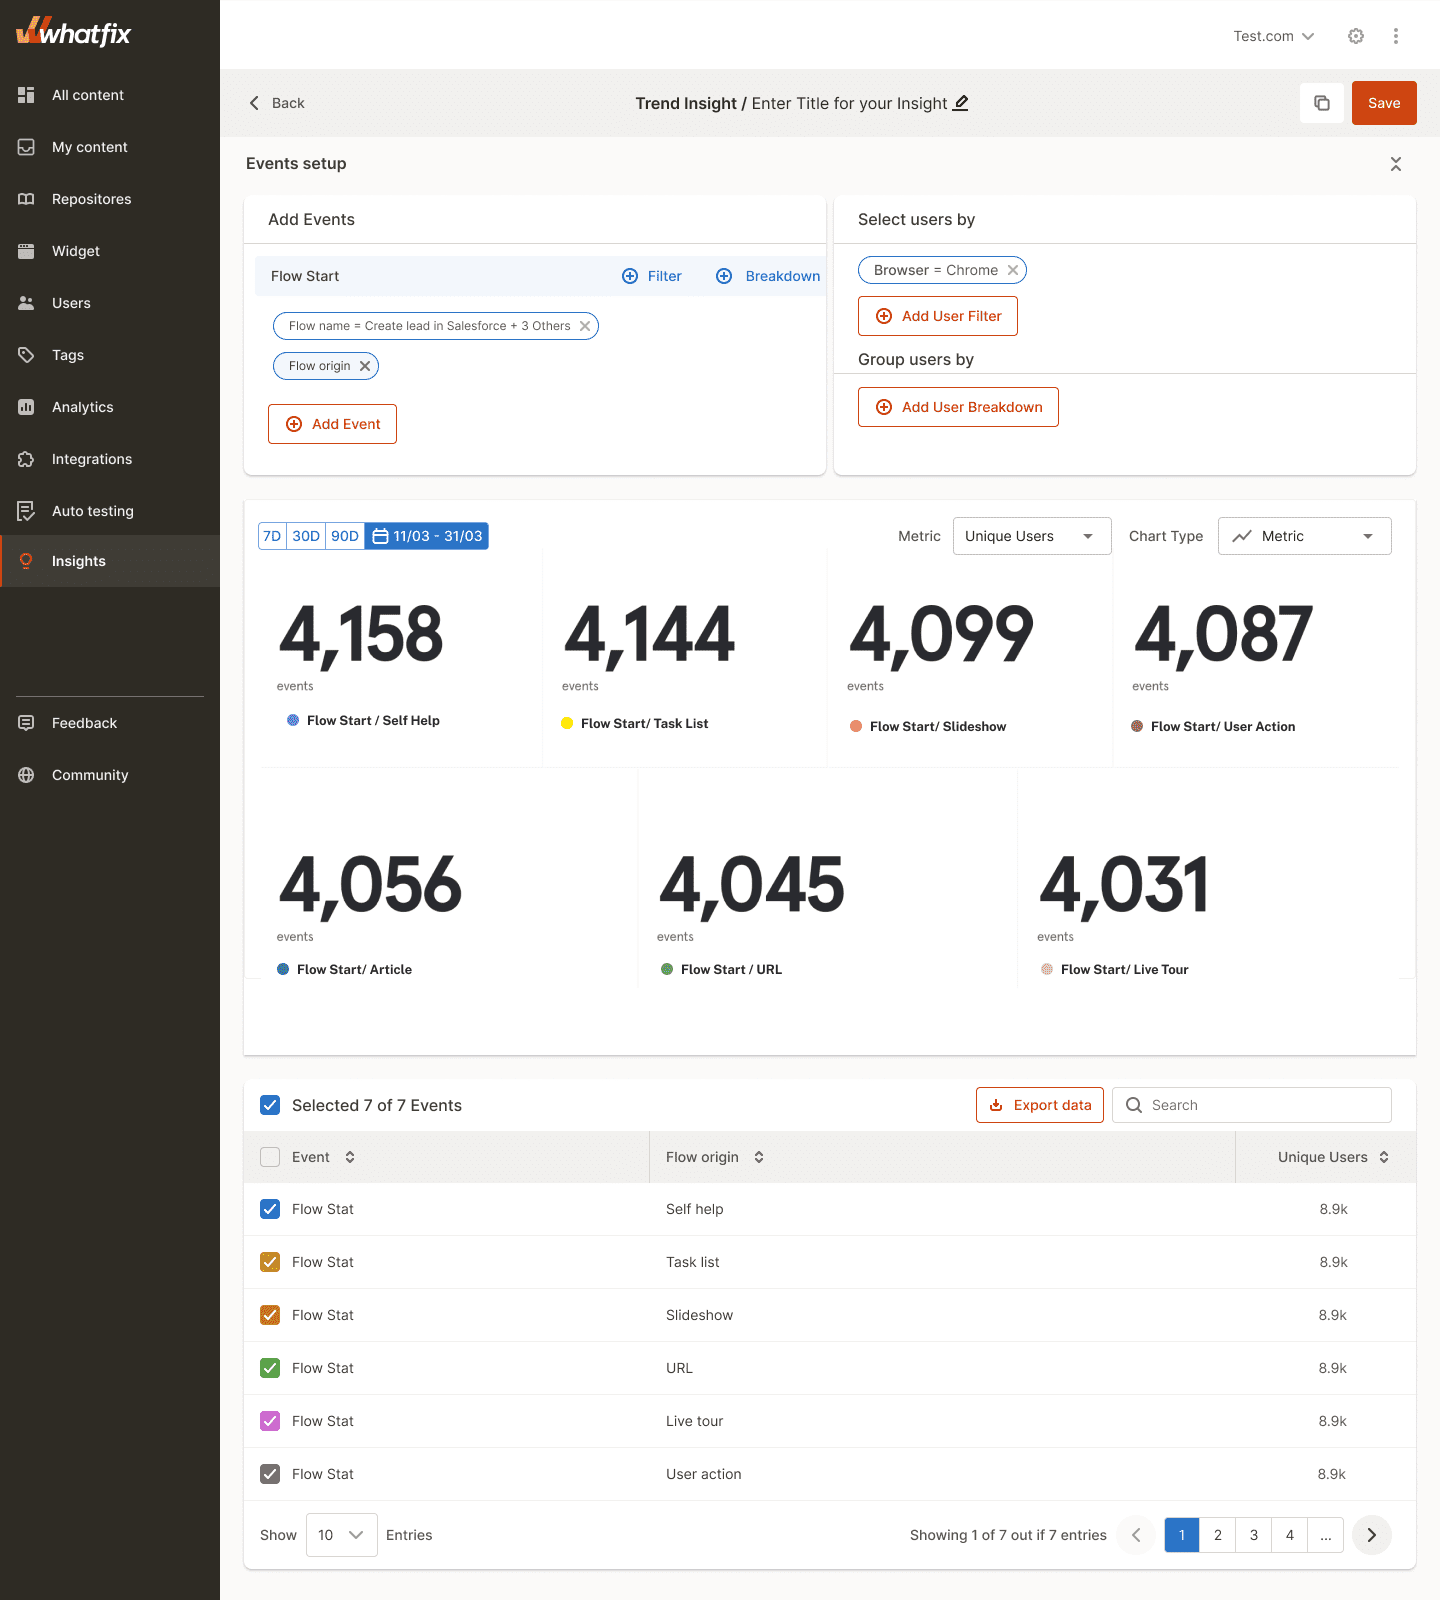
With a no-code product analytics software like Whatfix, empower product managers, IT teams, and anyone who requires insights into product usage and digital adoption with the ability to track end-user engagement, identify trends and areas friction points, map user flows and journeys, create user cohorts, monitor end-user analytics, and more.
2. Create a team of stakeholders
Product analytics are a team sport. Everyone involved in the product management & promotion process needs a seat at the table so they can:
- Observe how users engage with your product,
- Figure out a strategy in response, and
- Coordinate their efforts with the rest of the team to tackle your product development cohesively.
That counts in product managers, developers, engineers, marketers, designers, and the C-suite.
3. Define your core metrics & your approach to tracking them
Make a shortlist of the metrics you intend to monitor & create an action plan on how you’ll leverage them in your product development decisions.
Examples of product adoption metrics include:
- Active users
- Retention rate
- User activation rate
- Engagement
- Churn rate
- Usage frequency
- Feature adoption
Depending on your product’s maturity and the size of your (product analytics) team, you can focus on just a few core metrics, benchmark your product’s performance, optimize your product to improve them, and avoid overwhelming your team with dashboards and reports.
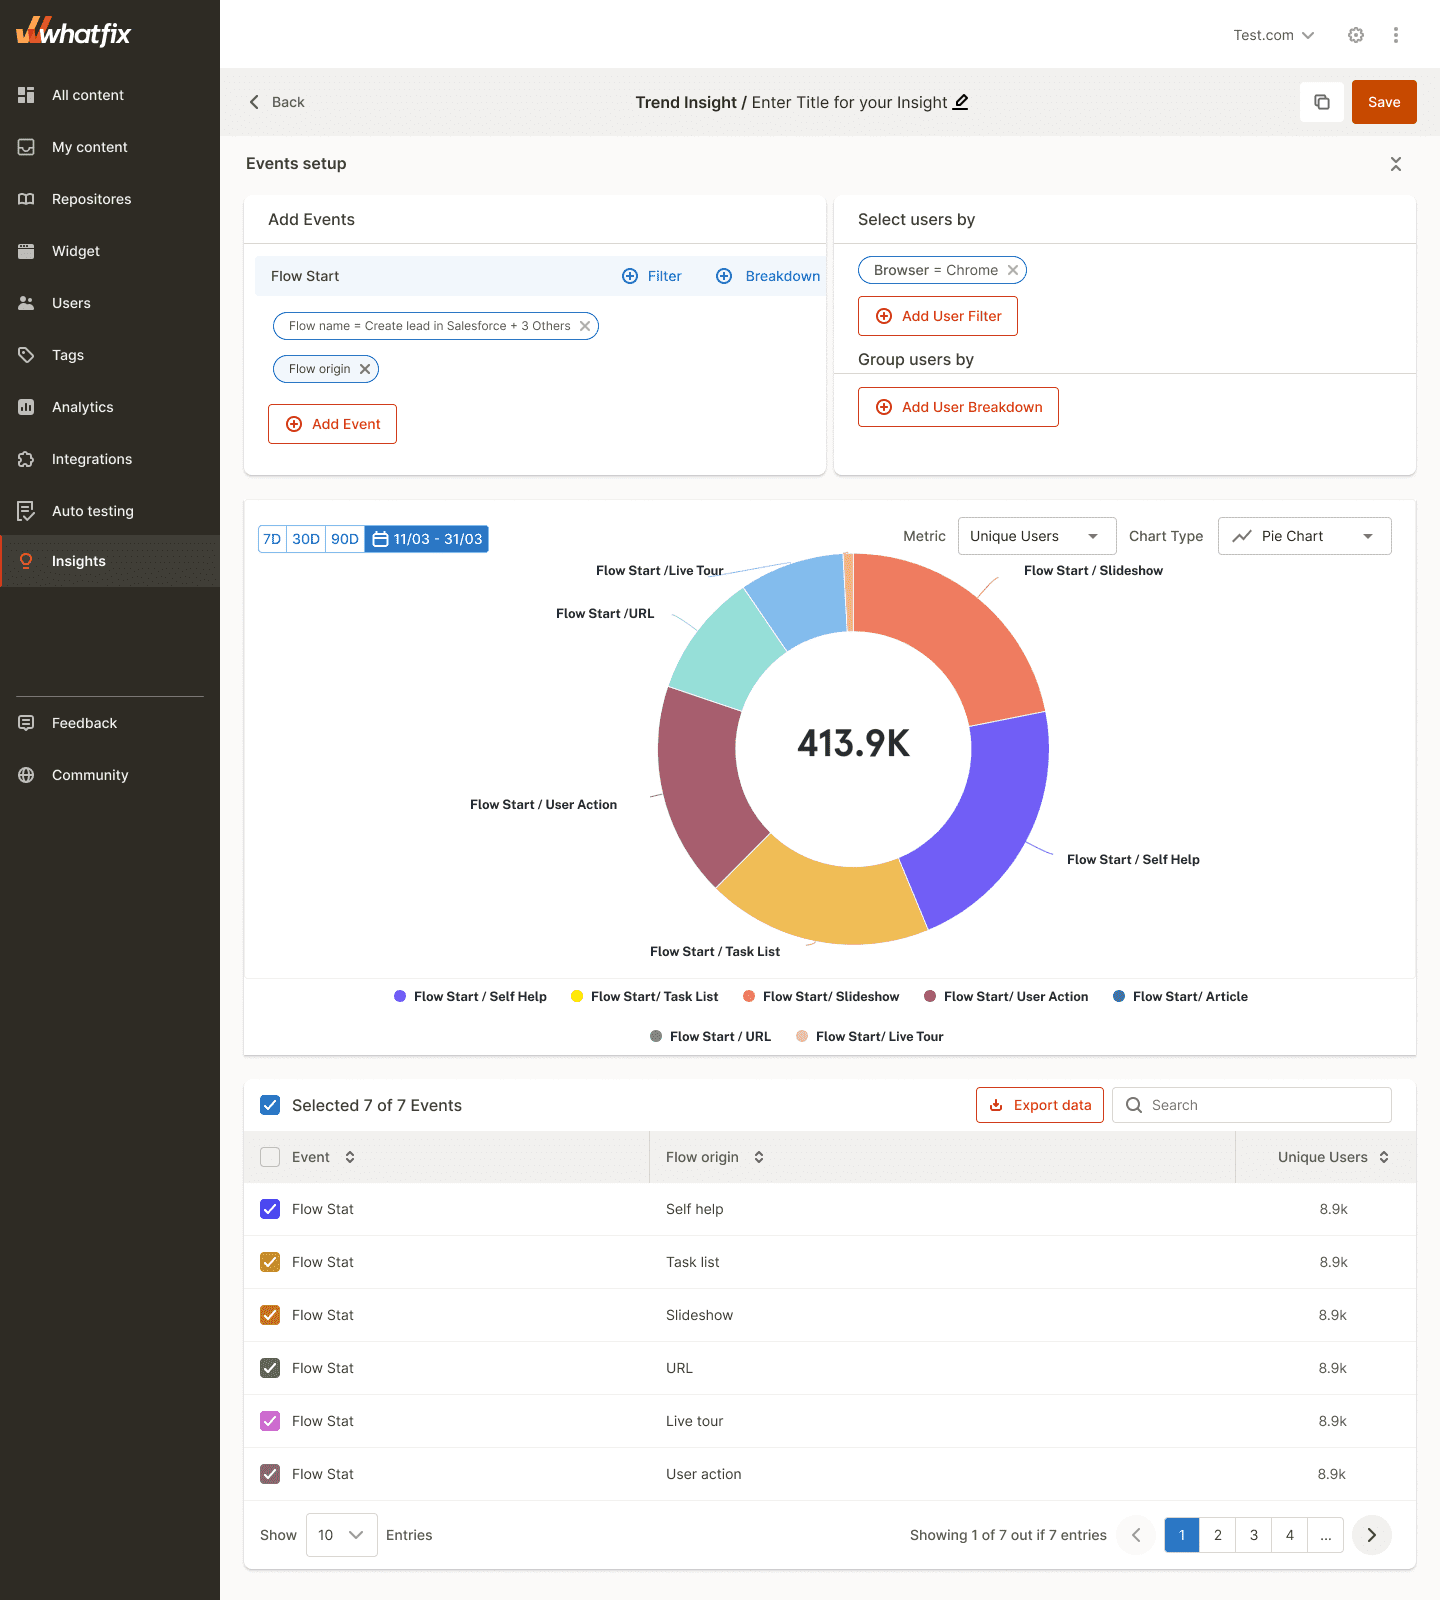
4. Use your product analytics stack to make data-informed decisions
Product analytics is only one part of the product optimization process. That is, it doesn’t make much of a difference if you only collect and display lots of metrics on nice-looking dashboards and reports.
Make your product analytics a core of your product development process, use historical data to predict performance, and keep optimizing your user experience so that you can maintain a product customers want to pay money for.
5 Best Product Analytics Software Tools in 2022
There are dozens of product analytics software platforms that offer a wide range of features, at price points, and with various levels of technical complexity.
You want an analytics solution that can help your product stakeholders capture product usage insights and execute them with little friction, for a great price, which even the non-technical users on your product team can figure out.

1. Whatfix
Whatfix is a digital adoption platform and product analytics platform that allows product managers to create in-app content and experiences and track how users engage with this content, as well as provide real-time feedback on their experience.
The Whatfix platform helps drive product adoption through:
- Tracking user journeys to identify issues, feature usage, and adoption trends.
- Capturing insights on how users interact with every element inside your applications.
- Offering in-app guidance, contextual reinforcement assistance and training, and on-demand support with any section of your application a user is interacting with.
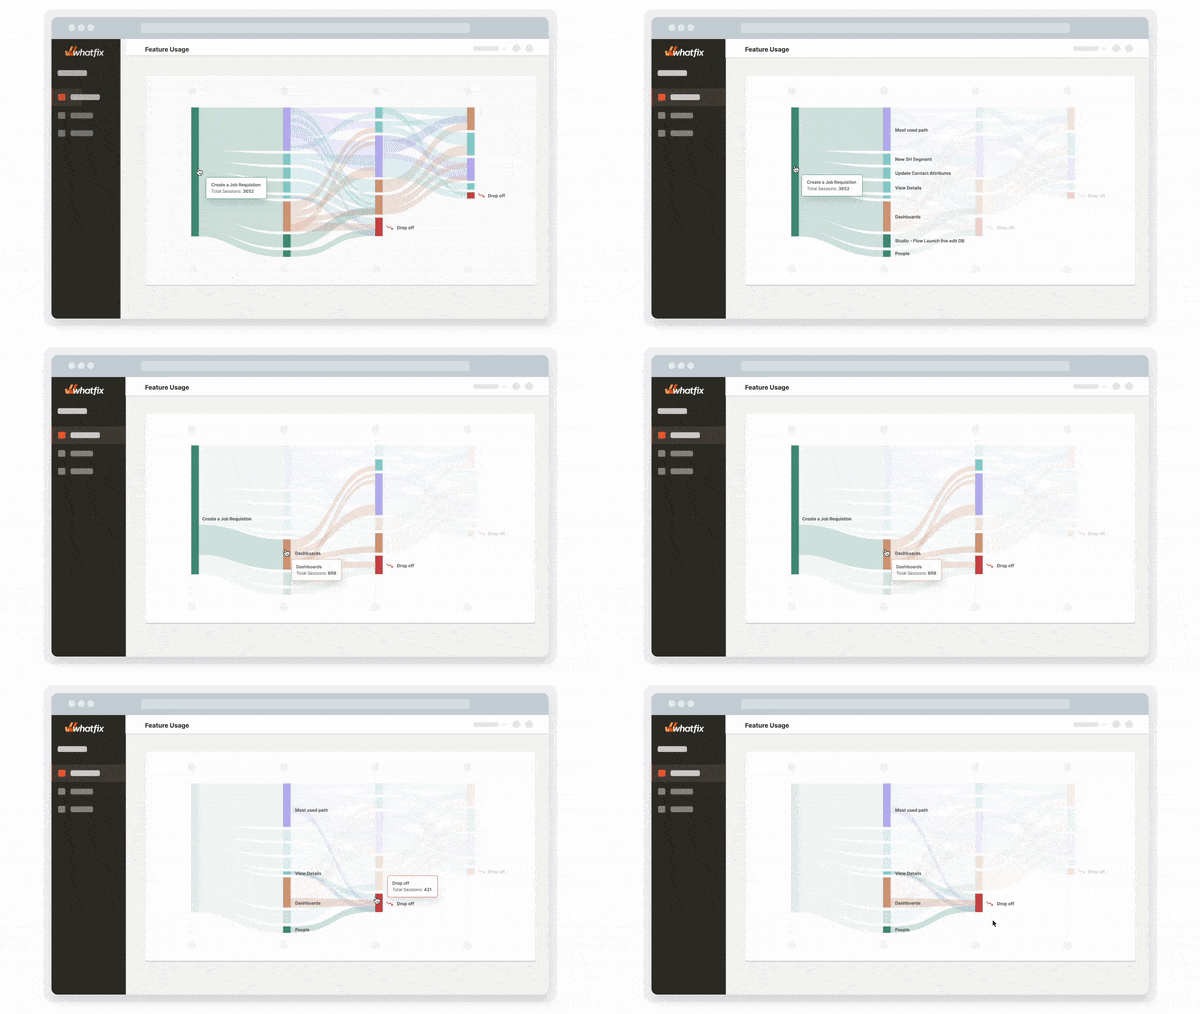
Whatfix’s product analytics toolkit provides a window into what your user experience looks like, and empowers product teams to make data-driven decisions that reduce support tickets and friction points, increase conversions, create better customer experiences, and increase overall product adoption.
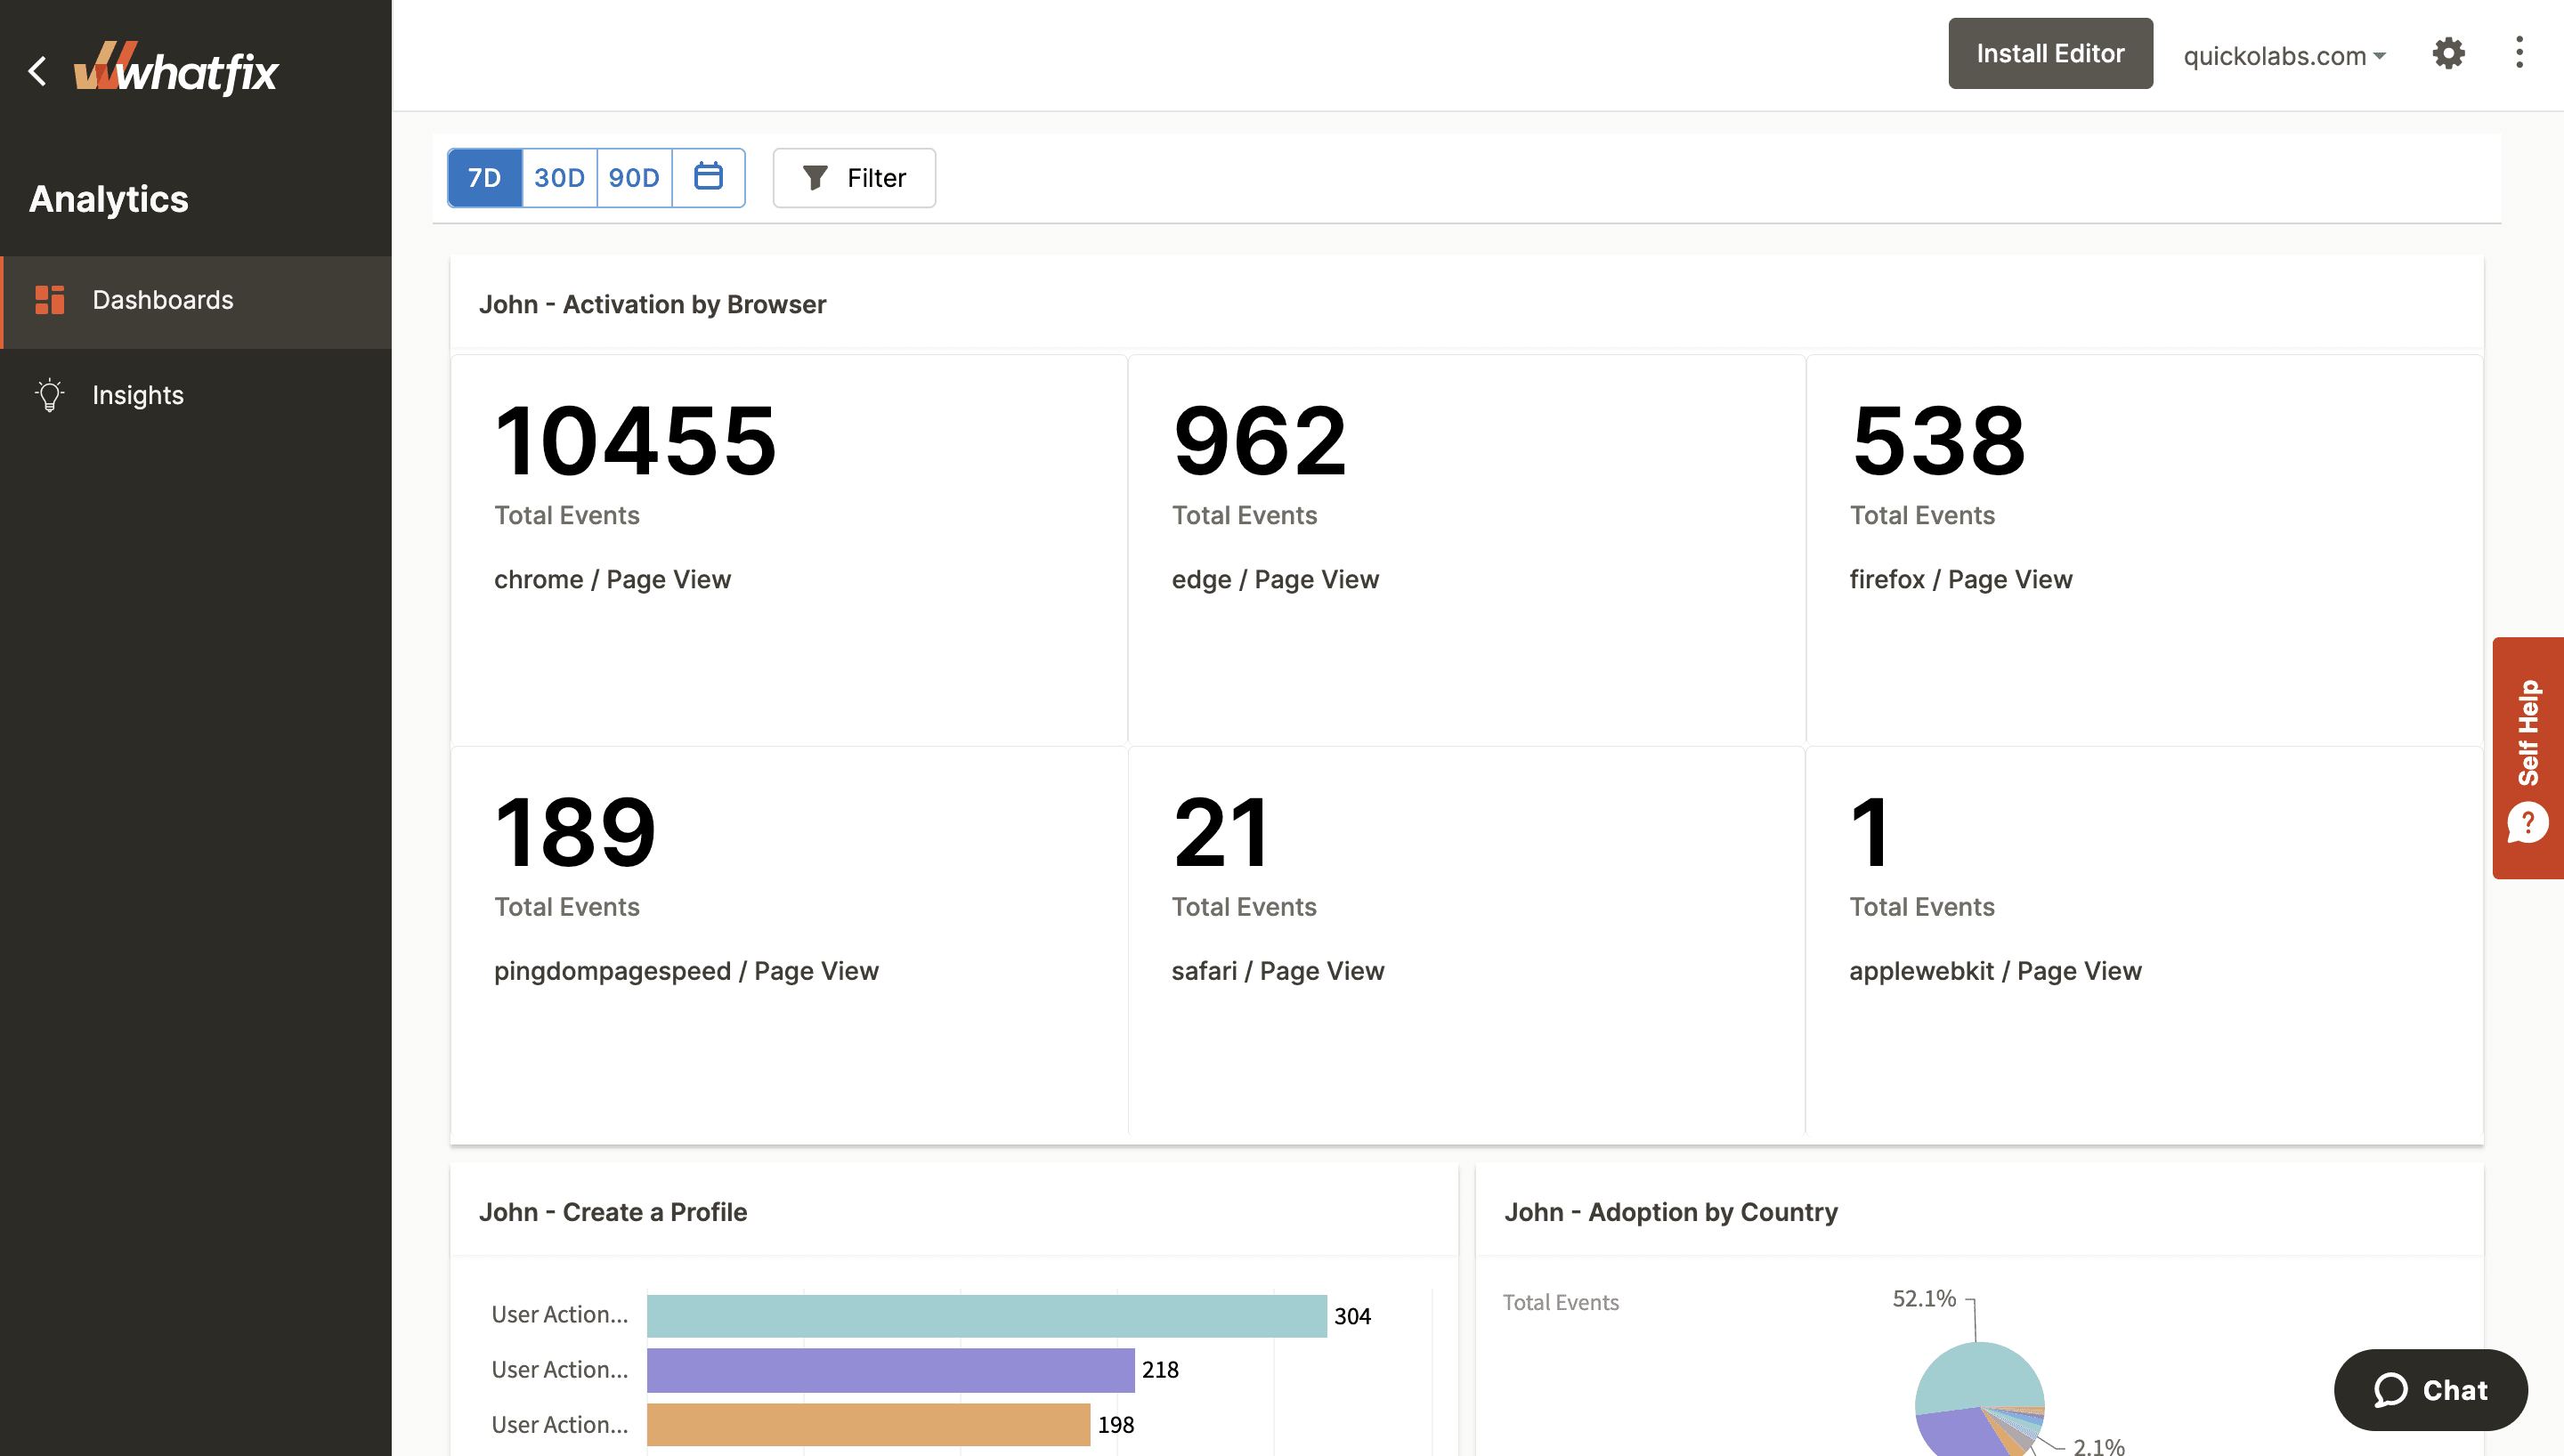
Whatfix stands out because of its hybrid approach to product analytics that allows organizations to track custom events with a no-code implementation.
This allows product managers to set up their custom product analytics framework, manage and update their strategy, and sift through data in an easy-to-consume dashboard – all without relying on development or engineering support.

2. Amplitude Analytics
- G2 Review Rating: 4.5 out of 5 stars
- Price: Starts at $900 per month
Amplitude is a product analytics platform that allows product teams to understand user behavior to increase engagement, create more conversions, and drive revenue. The platform is an optimization system that helps you craft the user journey and anticipate a customer’s next move before they do.
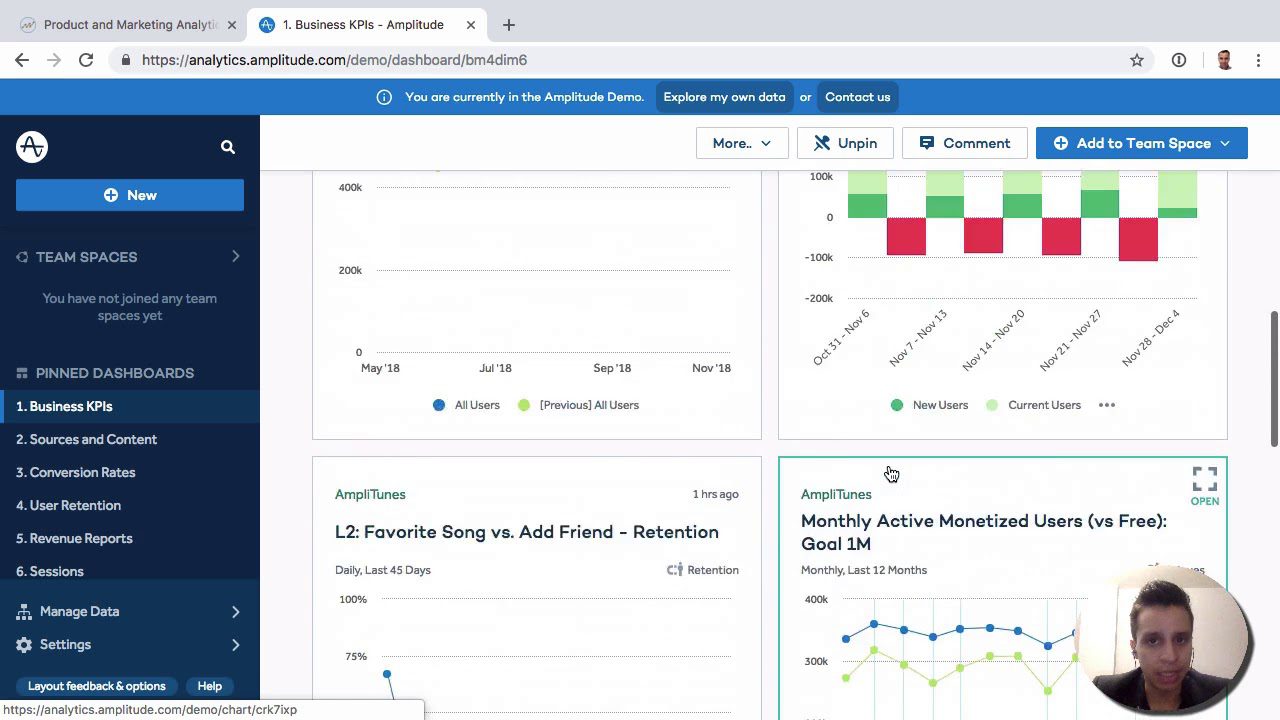
Amplitude is an example of a product analytics strategy that relies on explicit event tracking. This type of event tracking requires product teams to manually define what events you’re tracking with a code-based implementation.
While this provides detailed, custom data tracking, it relies heavily on development and engineering teams to build your code-based event tracking framework. Anytime a new event needs to be tracked or a feature is launched, your framework will require additional engineering support.
For smaller teams without development support, or product-led growth teams led by non-technical product managers, Amplitude may not be the best fit. While it’s a robust product analytics platform, its reliance on engineering resources can make it a major roadblock for many.
TIP: Product teams face a decision of choosing an explicit event tracking or implicit event tracking strategy for their product analytics. You can learn more about the benefits, challenges, and use cases for both in our explicit vs. implicit event tracking guide.

3. Mixpanel
- G2 Review Rating: 4.5 out of 5 stars
- Price: Limited free plan; paid tier starts at $25 per month
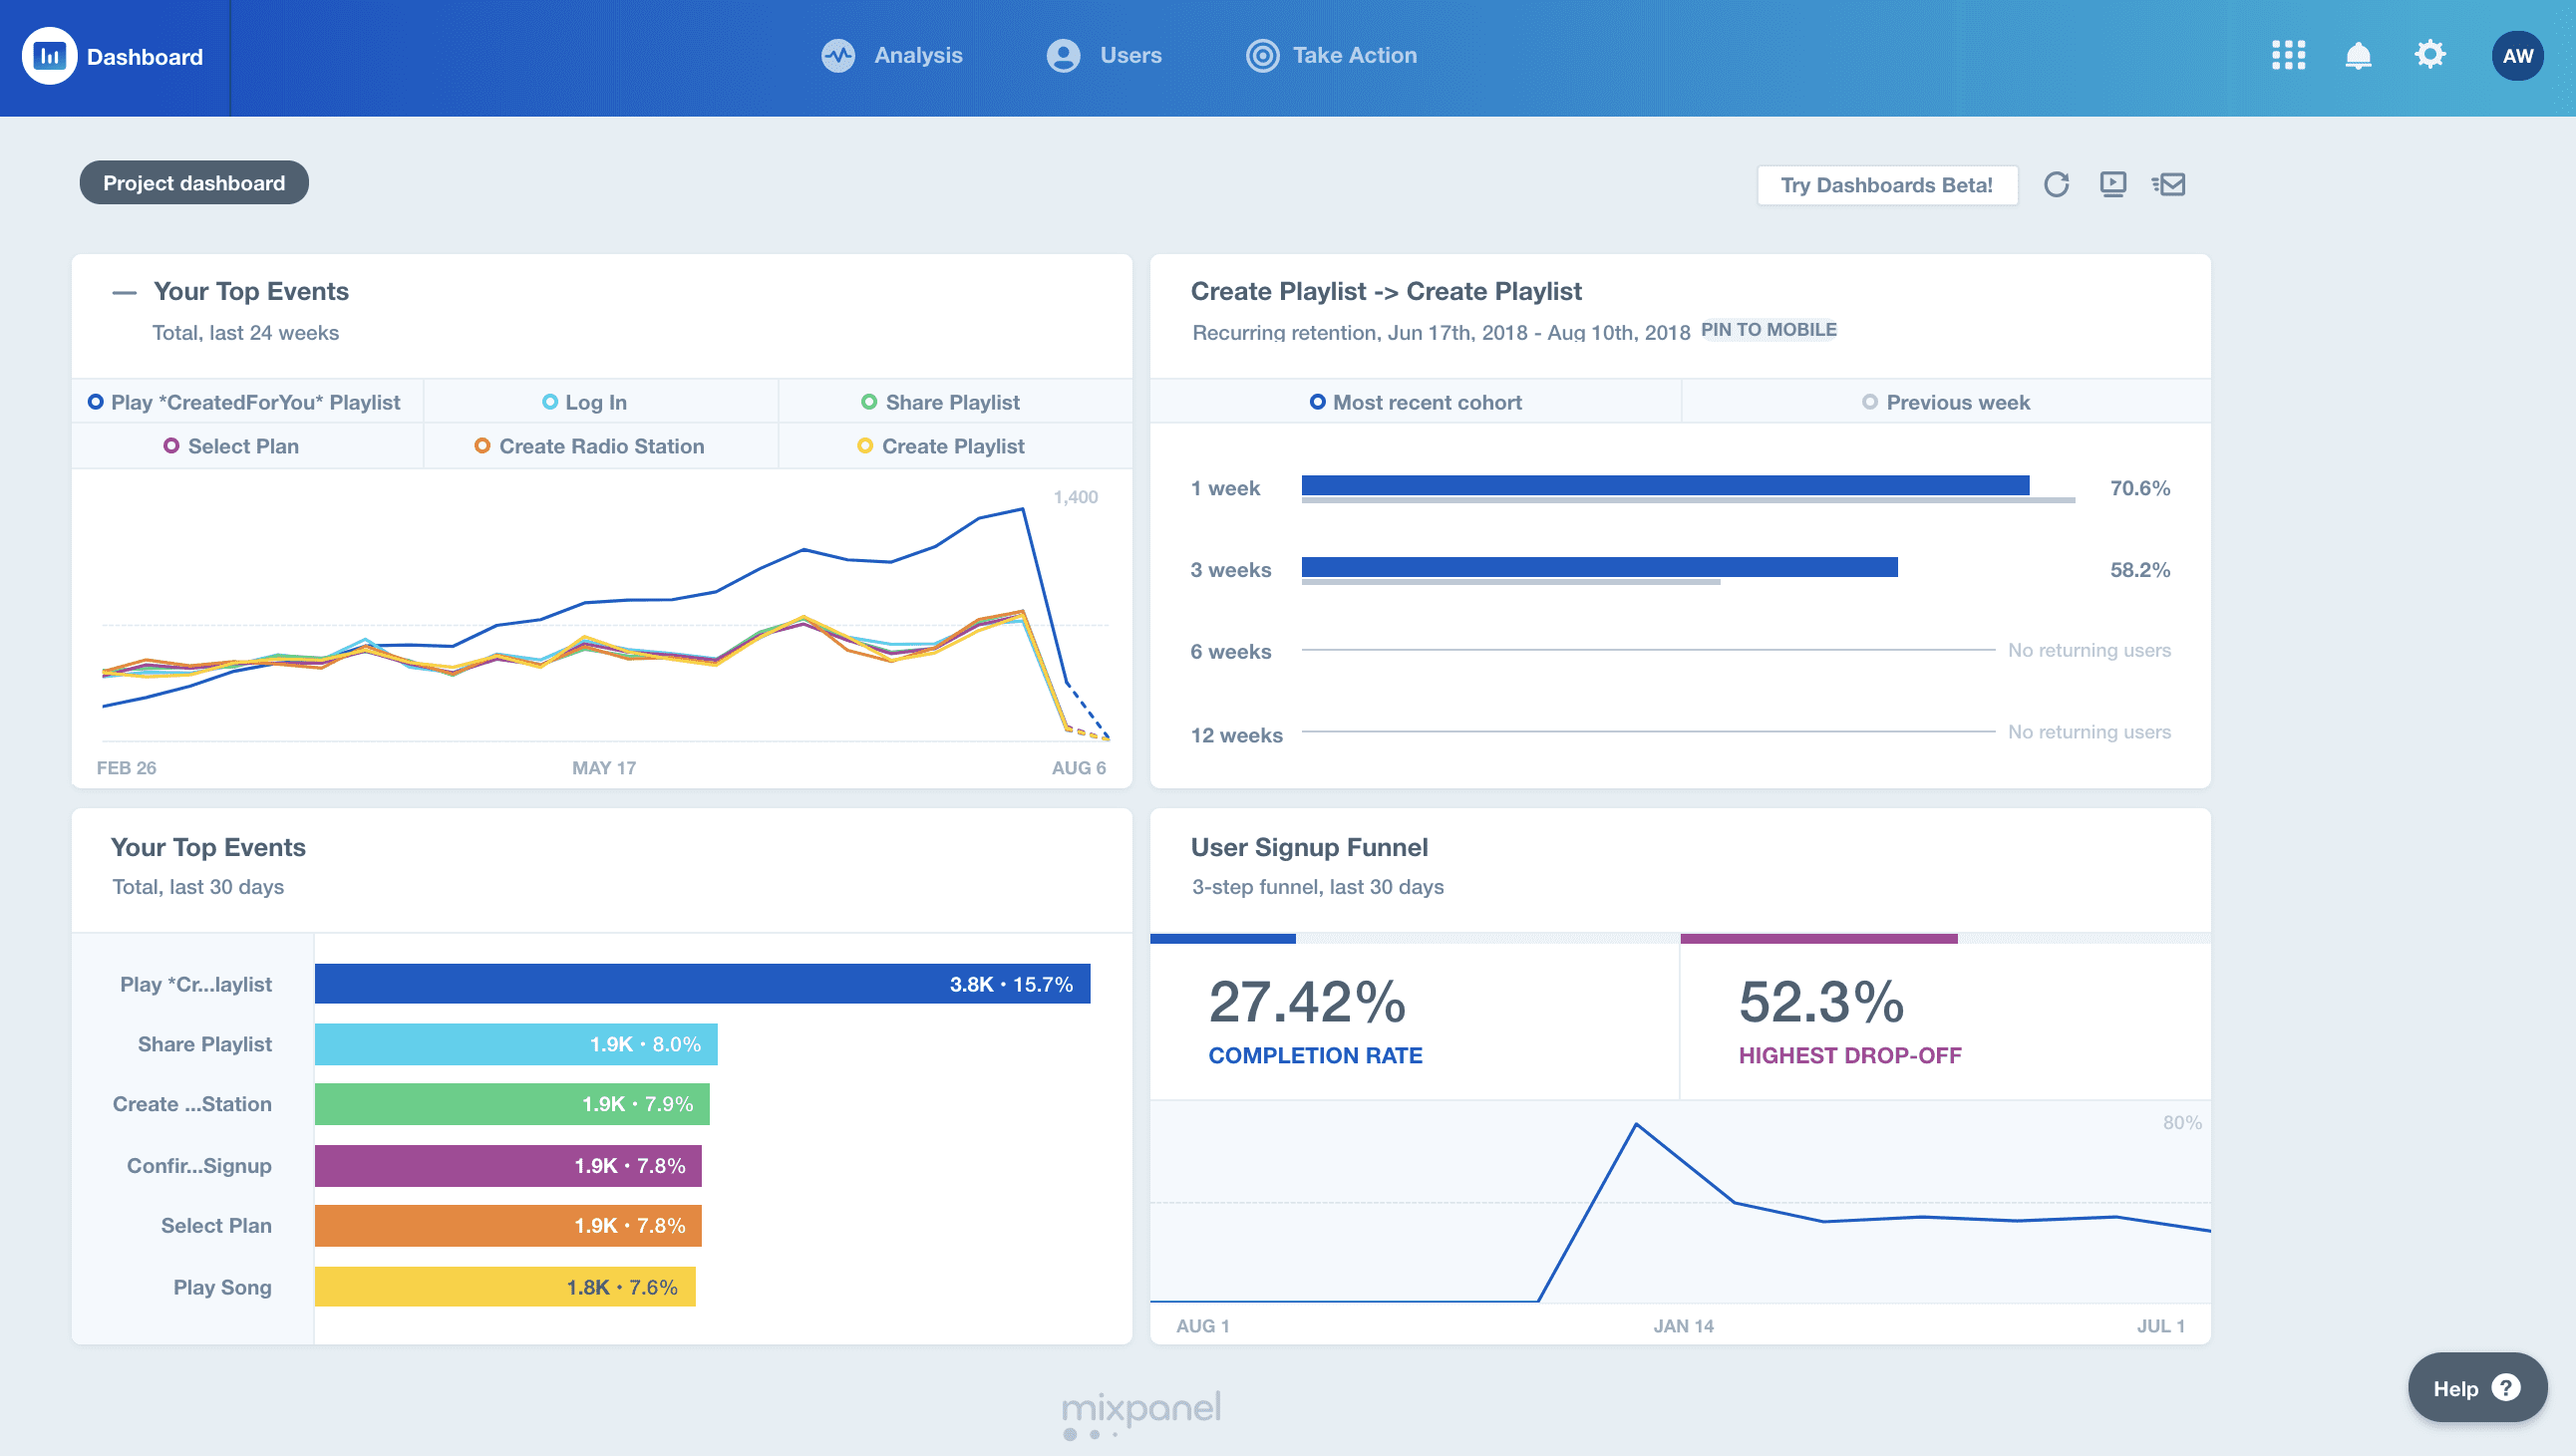
Mixpanel is another market leader in the product analytics space that provides teams with self-service dashboards pulling from code-based explicit event tracking set up by their engineering team. This allows product teams to make product decisions based upon these findings. Mixpanels’s product intelligence tools make it easy to track product usage, figure out churn, retain users predictively, and scale your product insights with customizable workflows.
As with Amplitude, Mixpanel requires heavy engineering support to set up, manage, and support a code-based analytics implementation, and may not be a suitable option for agile organizations or teams that lack proper engineering resources.

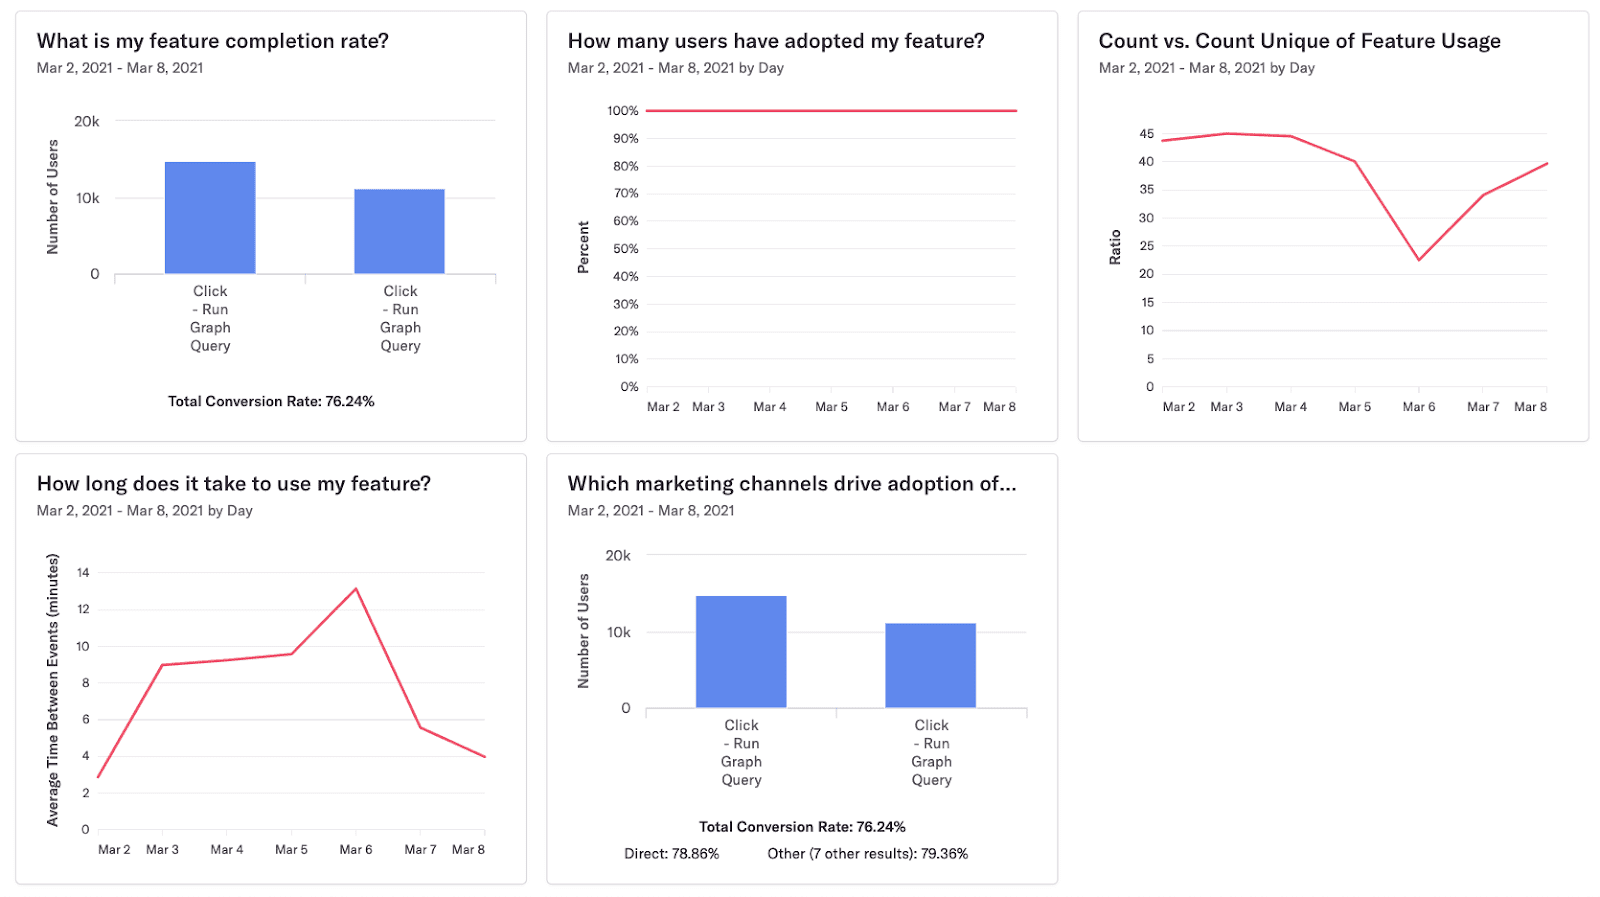
4. Heap
Heap is a digital insights platform that allows product teams to capture and analyze the customer journey with product analytics, behavioral analytics, and customer feedback. It automatically tracks entry and exit pages, session metrics, retention, conversions, and all the data on your customers’ behavior.
Heap also offers predictive analytic functions like its effort analysis, which shows you which features your users struggle with. It also provides recommendations on actions to take, such as pageview suggestions based on historical customer behavior.
Compared to Amplitude and Mixpanel, it’s a low-code alternative requiring much less development support.

5. Google Analytics
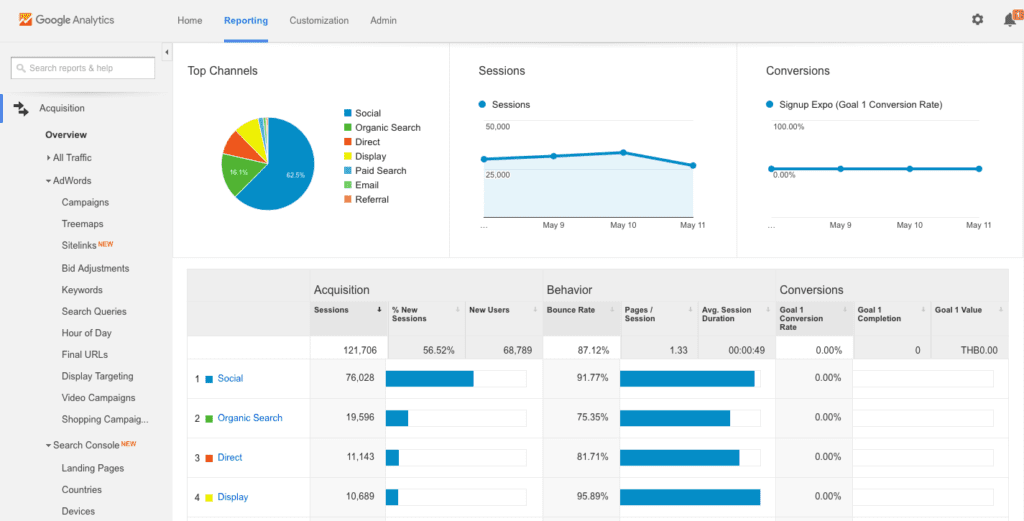
On the surface, Google Analytics should be the most accommodating analytics platform. It’s been around forever, is widely used, has a robust free tier, and you’re probably already familiar with using it for marketing. That happens to be its biggest downside.
Google Analytics is designed around the needs of marketers who want to boost traffic and conversions on their marketing campaigns, and monitor overall marketing spending. That does not translate well to tracking in-app user behavior, measuring engagement metrics, and detecting churn before it happens.
A few challenges of using Google Analytics as a product analytics solution include:
- To gain the in-depth insights that make product analytics so powerful, teams must define events ahead of time in Google Analytics.
- Regulations restrict what it can and can not track – for example, GA can’t process PII data (personally identifiable information).
- Google Analytic’s interface is outdated and clunky, making it difficult to set up custom event tracking and analyzing that data.
Whatfix’s hybrid digital adoption platform and product analytics empower product managers to create in-app experiences to drive product adoption, reduce friction, and capture and analyze their product and user data on how effective these flows and experiences are.
Learn how Whatfix can transform your product adoption with better analytics now.
Request a demo to see how Whatfix empowers product teams to create incredible products with no-code tools to build and analyze in-app content and flows.
Thank you for subscribing!
